3 Key Indicators to Evaluate a DeFi Project Before Investing
By Captain Trading··5 min
Contents14 sections
With the sheer number of new projects arriving in DeFi (decentralized finance), it can become particularly difficult to verify the “intrinsic” value of the investment products on offer. So today, we’re going to focus on 3 key, accessible indicators for evaluating a DeFi project objectively before investing a single euro. Here’s another free trading & crypto course available to you at no cost! To go further on the subject, also check out our complete guide to DeFi.
A quick reminder as well: none of these indicators is sufficient on its own — it’s exactly the same logic as in traditional trading. Combining them is strictly essential to get as close as possible to a perfectly objective view of a DeFi protocol’s value.
What is a DeFi project (and why evaluate it before investing)?
DeFi (Decentralized Finance) brings together all the financial applications (lending, borrowing, trading, yield) built on the blockchain, with no banking intermediary. In practice, these are open protocols that anyone can access through a wallet to swap, lend or deposit assets in just a few clicks. The flip side: anyone can also launch a project, which multiplies copies, opportunistic forks and outright scams. Hence the value of having a few simple indicators to sort the wheat from the chaff.
1 Total Value Locked (TVL) and Market Cap: the first health indicator of a DeFi project
Total Value Locked (TVL) represents the amount currently staked or deposited in a DeFi protocol. The argument is simple: the larger the amounts locked in the Dapps, the more the protocol earns the trust of the crypto community.
Naturally, this inspires investor confidence and serves as strong social proof.
Where to find TVL: DeFiLlama, the go-to source
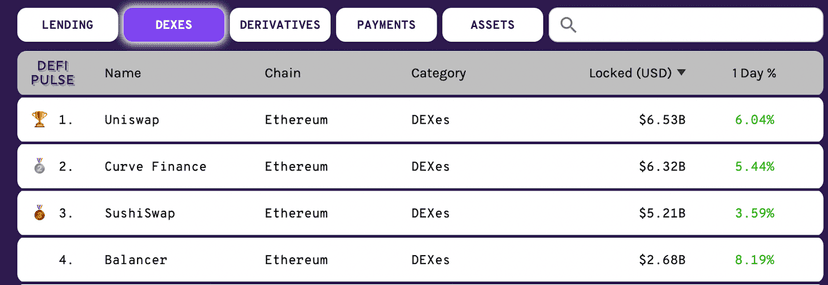
To start your analysis, today’s go-to source is DeFiLlama (defillama.com): it has become the de facto standard for tracking the TVL of every DeFi protocol, chain and category, for free and in real time. The historic pioneer defipulse.com is still mentioned here and there, but it has barely been updated since 2021-2022, so go with DeFiLlama instead. To cross-reference this data with market cap, market cap and TVL tracking tools like CoinMarketCap or CoinGecko round out your monitoring perfectly.
The “locked” column gives you the TVL on the homepage. Then, once you’ve found the product you’re interested in, simply click on it to get: statistics on the product’s growth, clear charts, a summary of the applications provided by the protocol in question, along with all the links you need to learn more about it.
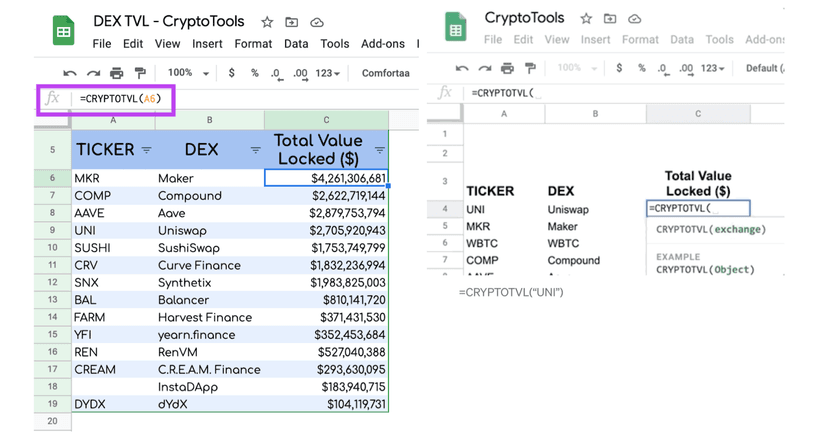
With CoinGecko, you’ll also get the TVL figures, which you can export as an XLS file for more in-depth analysis. This also lets you set up your own monitoring system for the projects you care about. Worth noting: to then buy the tokens of the projects you’ve selected, a regulated platform like OKX remains a recognized reference for its security and transparency.
The limits of TVL
Be careful: a high TVL guarantees nothing on its own. It can be artificially inflated by incentives (liquidity “mining”, very high yields) that evaporate as soon as the rewards stop. A TVL growing steadily over several months is far more telling than a sudden spike. This is precisely why you need to combine it with the two indicators below.
2 The Price-to-Sales Ratio (P/S Ratio) applied to DeFi: measuring a protocol’s valuation
In a conventional market, the P/S ratio is actually the total value of a company’s shares compared to its revenue. It’s a fundamental indicator widely used in traditional stock market analysis.
When it comes to a DeFi protocol, we can see that it also generates revenue (transaction fees, swap fees, interest, etc.).
Incidentally, if you’re interested in the data on the revenue generated by each platform, all of it is available on cryptofees.info, as well as in the Fees and Revenue sections of DeFiLlama, which are even more complete today. You’ll also be able to compare revenue over one day and one week there.
Since a great many protocols now generate revenue, an indicator similar to the P/S Ratio has emerged specifically for crypto. So:
Crypto P/S ratio = (Market Cap ÷ Revenue)
The point is to determine whether a protocol is fairly valued or not. Put simply, the lower the ratio, the more potentially undervalued the protocol is. The higher the ratio, the more likely it is overvalued relative to its fundamentals.
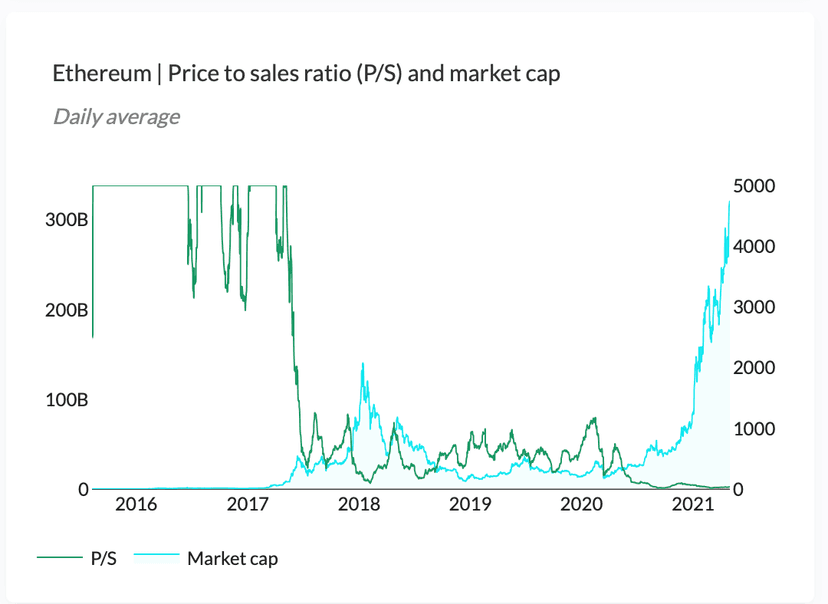
For example, in the case of Ethereum (ETH), a Grayscale report published in early 2021 pointed out that Ethereum appeared undervalued from a P/S ratio standpoint: at the time, it hovered around 0.02.
“A lower ratio indicates that the network generates significant revenue when you look at the history of its market capitalization. It is therefore very likely undervalued.”
Keep in mind that this figure is a historical benchmark: it’s used here to illustrate the method, not to give a current valuation. It’s up to you to recalculate the ratio on today’s data for the protocol you’re interested in.
Where to track the P/S ratio today
Good news: the go-to tool for this fundamental data is still very much active. Token Terminal (terminal.tokenterminal.com) offers an up-to-date Price-to-sales dashboard and has even since become one of the leading references for comparing the fundamentals of crypto protocols. There you can view the kind of chart that highlighted the observation made in the Grayscale report on ETH’s market cap.
3 Inflow and Outflow: monitoring the available supply on exchanges to anticipate moves
When we talk about In Flow, we mean the inflows onto one or more exchanges (deposits).
When we talk about Out Flow, we mean the outflows from one or more exchanges (withdrawals).
If we add up the inflows and outflows, we get the available supply of an asset — a good proxy for an asset’s liquidity and for the buying or selling pressure building up. Here, the principle is fairly simple: from a massive influx of supply we infer upcoming selling pressure, since holders are visibly preparing to exit.
Remember a while back when people were talking about the massive BTC outflows from exchanges: we inferred that supply would be lower and that buying pressure was therefore building. The same goes for any crypto asset.
Conversely, if we observe massive inflows onto exchanges, we infer that sellers are back in force, signaling an imminent drop in price.
In the case of crypto, it’s also very useful to monitor the supply of USDT (a stablecoin). Indeed, if it rises, we infer that relative buying pressure will kick in sooner or later, because these stablecoins are ready to be converted into crypto.
To get started in practice…
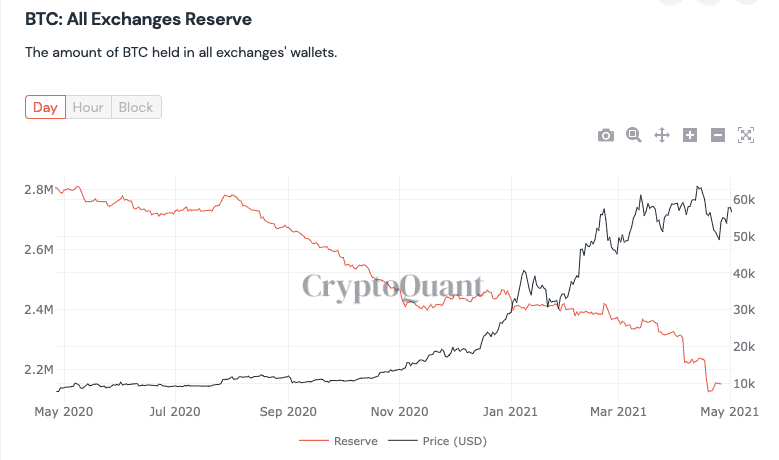
There are many resources available to access this type of on-chain indicator. Albeit offers a paid solution, while CryptoQuant offers a free solution to monitor BTC and stablecoin flows. Here’s a link to get BTC flows. If you want to go further and learn how to monitor the inflows and outflows of exchanges with the right tools (CryptoQuant, Glassnode, Nansen), our dedicated course lays out the full method.
Incidentally, you’ll notice that BTC reserves on exchanges have tended to decline, suggesting that demand remains high and that holders prefer to store in a cold wallet rather than sell. On that note, if you’re just starting out, first learn how to create a wallet to access DeFi and interact with Dapps entirely on your own.
Here’s a link to get stablecoin flows. You can find additional resources via nansen.ai and glassnode.
2026 update: the ecosystem has evolved
This article was originally published in 2021. The method still holds (TVL, P/S ratio, on-chain flows), but a few reference points have changed:
DeFiLlama has established itself as the go-to source for TVL, in place of DeFi Pulse, which is no longer actively maintained.
Token Terminal is still active and remains the essential tool for the P/S ratio and protocol revenue.
On the European regulatory side, the MiCA framework came into force gradually in 2024-2025: it now regulates part of the crypto and stablecoin ecosystem, a factor to build into your risk analysis.
The exact figures (TVL, ratios, flows) change constantly: always use the tools above for up-to-date data, and never make a decision based on a single indicator.
FAQ: evaluating a DeFi project
What is the TVL of a DeFi project?
TVL (Total Value Locked) is the total amount of assets deposited or staked in a DeFi protocol. The higher and more stable it is over time, the more trustworthy the protocol — but a TVL inflated by temporary rewards should raise a red flag.
How can you tell if a DeFi token is over- or undervalued?
You use the crypto P/S ratio: Market Cap ÷ protocol revenue. A low ratio suggests potential undervaluation, a high ratio overvaluation. Token Terminal lets you compare this ratio across protocols.
Which free tools can you use to analyze a DeFi project?
DeFiLlama for TVL, Token Terminal and cryptofees.info for revenue and the P/S ratio, and CryptoQuant/Glassnode/Nansen for on-chain flows (inflow/outflow). CoinGecko and CoinMarketCap round out your market cap monitoring.
Is a single indicator enough to invest in DeFi?
No. As in traditional trading, no indicator is reliable in isolation. TVL, P/S ratio and on-chain flows must be cross-referenced to get an objective view, and complemented by genuine risk management.
This article appeared in one of our first free newsletters! If you’d like to regularly get this kind of educational content, news, opportunities and the Captain’s best tips, all you have to do is sign up in a few seconds below.
If you want to take things up a notch… I invite you to head to the free Captain Trading space right away!
Join the free Captain Trading space: with a simple account, you get the daily plan in your trading journal, decoded COT reports, lives and their replays, and the community help room built right into your dashboard — you ask your question in your language and we answer in your language! It’s all free. If you’d like to support us, open an account with one of our partner platforms through the Cashback page: 5% of your trading fees are yours for good, and 10 to 20% in the months when your volume justifies it — that’s what allows us to keep going.