Liquidity: Definition in Trading
Liquidity refers to the efficiency or ease with which an asset or a security can be traded and converted into cash without affecting its price. The most liquid asset of all is theoretically cash itself. That said, given the restrictions on spending — or even holding — banknotes, this could well change in the future! And why shouldn’t the most liquid assets one day become decentralized cryptos, for example?! To analyze liquidity across the markets, I recommend Coinalyze first, then TradingView to round out your technical analysis !
Liquidity: An Essential Concept in Trading!
In other words, liquidity describes the degree to which an asset can be quickly bought or sold on the market at a price that reflects its intrinsic value. Banknotes (cash) are universally regarded as the most liquid asset, because they can be converted quickly and easily into other assets. Tangible assets, such as real estate, works of art and collectibles, are all relatively illiquid. Other financial assets, ranging from stocks to company shares, sit at various points on the scale from least to most liquid.
For example, if someone wants to buy a €500 television, cash is the asset that can most easily be used to obtain it. If that person has no cash but owns a collection of rare stamps appraised at €500, they are unlikely to find anyone willing to swap the television for their collection. Instead, they will have to sell the collection and use the proceeds to buy the television. That may be fine if the person can wait months or years to make the purchase, but it becomes a problem if they only have a few days. They may have to sell the stamps at a discount rather than wait for a buyer willing to pay full value. Rare stamps are an example of an illiquid asset.
Liquidity: The Two Definitions in Finance.
Be careful not to confuse the liquidity of a market with the liquidity of a company
1. Market Liquidity
Market liquidity refers to the extent to which a market — such as a country’s stock market or a city’s real estate market — allows assets to be bought and sold at stable, transparent prices. In the example above, the market for televisions in exchange for rare stamps is so illiquid that it doesn’t exist.
The stock market, by contrast, is characterized by greater market liquidity. If an exchange has a high trading volume that isn’t dominated by selling, the price a buyer offers per share (the bid price) and the price the seller is willing to accept (the ask price) will be fairly close to each other.
Investors therefore won’t have to give up unrealized gains for the sake of a quick sale. When the gap between the bid price and the ask price tightens, the market is more liquid; when it widens, the market becomes more illiquid instead. Real estate markets are generally far less liquid than stock markets. The liquidity of markets for other assets — such as derivatives, contracts, currencies or commodities — often depends on their size and on the number of open exchanges where they can be traded.
2. Accounting Liquidity
Accounting liquidity measures how easily a person or a company can meet their financial obligations with the liquid assets available to them — in other words, the ability to pay off debts as they come due.
In the example above, the rare-stamp collector’s assets are relatively illiquid and probably wouldn’t fetch their full €500 value in a pinch. In investment terms, assessing accounting liquidity means comparing liquid assets against current liabilities — that is, the financial obligations that fall due within the year.
There are a number of ratios that measure accounting liquidity, and they differ in how strictly they define “liquid assets.” Analysts and investors use them to identify companies that have significant liquidity.
Measuring Liquidity
Financial analysts look at a company’s ability to use its liquid assets to cover its short-term obligations. As a rule, when using these formulas, a ratio greater than one is desirable.
The cash ratio is the strictest of the liquidity ratios. By excluding accounts receivable, as well as inventory and other current assets, it defines liquid assets strictly as cash or cash equivalents.
In investment terms, stocks as a class are among the most liquid assets. But not all stocks are equal when it comes to liquidity. Some stocks trade more actively than others on the exchanges, which means there is a larger market for them. In other words, they attract greater and more consistent interest from traders and investors. These liquid stocks are usually recognizable by their daily volume, which can run into the millions, or even hundreds of millions, of shares.
The Role of Liquidity: Facilitating Trade
If markets aren’t liquid, it becomes difficult to sell assets or securities, or to convert them into cash. You might, for example, own a very rare and valuable family heirloom appraised at €200,000. However, if there is no market (that is, no buyers) for your item, that valuation means nothing, since no one will pay anything close to its appraised value — it is highly illiquid. You may even need to bring in an auction house to act as a broker and seek out potentially interested parties, which will take time and incur costs.
Liquid assets, on the other hand, can be sold easily and quickly at full value and at little cost. Companies also need to hold enough liquid assets to cover their short-term obligations, such as bills or wages, or else they risk facing a liquidity crisis that could lead to bankruptcy.
The Most Liquid Assets or Securities
Cash is the most liquid asset, followed by cash equivalents — that is, money markets, certificates of deposit or time deposits. Marketable securities such as exchange-listed stocks and bonds are often highly liquid and can be sold quickly through a broker. Gold coins and certain collectibles can also be readily converted into cash.
The Most Illiquid Assets or Securities?
Over-the-counter (OTC) securities, such as certain complex derivatives, are often fairly illiquid. For individuals, a house, a timeshare or a car are all somewhat illiquid, in that it takes several weeks — or even several months — to find a buyer, and several more weeks to finalize the transaction and receive payment. On top of that, brokerage fees tend to be quite high (for example, 5 to 7% on average for a real estate agent).
Are Some Stocks More Liquid Than Others?
The most liquid stocks are generally those that attract strong interest from the various market participants and that have a high daily trading volume. These stocks also draw a larger number of market makers who maintain a tighter two-sided market. Illiquid stocks show wider bid-ask spreads and less market depth. These names tend to be less well known, to have lower trading volume, and often a lower market value and volatility as well. Thus the stock of a large multinational bank will tend to be more liquid than that of a small regional bank.
Liquidity: What Does It Mean in the Crypto Markets?
As we’ve just seen, liquidity describes the state of an asset in terms of how easily it can be bought or sold. A market is therefore considered liquid if it allows trading at stable prices. Ultimately, it’s a measure of how many current and potential buyers and sellers there are in a market. Generally, more liquid markets trade at higher volumes, but volume alone doesn’t necessarily imply that there is enough liquidity.
More important than the volume traded is the participants’ willingness to buy and sell at an agreed price that doesn’t force the other party to take a substantial loss on the transaction itself. In other words, the buyer doesn’t have to pay well above what they consider a fair price, and the seller doesn’t have to sell well below what they consider the fairest price.
For a cryptocurrency trader, the liquidity of this particular market matters just as much as it does in any other market.
One of the most important questions any trader must ask before jumping in remains: “Is anyone available or willing to take the other side of the trade?” In other words: “Is the market I want to trade right now liquid enough?” or again: “Is there a risk that my orders won’t be filled because of a lack of liquidity?”
So, for any investment, one of the most important considerations is the ability to buy or sell that asset efficiently whenever the investor wishes. After all, what good is making a profit if the seller can’t actually realize their gains? The liquidity of the asset will largely determine whether, and to what extent, a prudent investor takes a position in the investment — and that extends to bitcoin and other cryptocurrencies.
Cryptocurrency liquidity refers to how easily a digital currency or token can be converted into another digital asset or into cash without affecting the price, and vice versa. Since liquidity is a measure of an asset’s external supply and demand, a deep market with abundant liquidity is a sign of a healthy market. What’s more, the greater the liquidity available in a cryptocurrency or digital asset, all else being equal, the more stable and less volatile that asset should be.
In other words, a liquid cryptocurrency market exists when someone is ready to buy when you’re looking to sell, and vice versa. It means you can buy as much of that digital asset as you want, take advantage of a trading opportunity or, in the worst case, cut your losses if the asset’s value drops below your cost — all without moving the market dramatically.
Benefits of a Liquid Crypto Market
- The ease with which a digital token can be converted into a digital asset or into cash without affecting its price is what’s called cryptocurrency liquidity.
- Cryptocurrency liquidity reduces investment risk and, above all, makes it easier to build an exit strategy by making it easier to sell your holdings.
- Cryptocurrency liquidity helps stabilize prices and reduce volatility, while also making it easier to analyze traders’ activity.
The Importance of Liquidity in Cryptocurrencies
Like any market, the cryptocurrency market depends on liquidity. Cryptocurrency liquidity reduces investment risk and, more importantly, helps you define your exit strategy by making it easier to sell your capital. As a result, as crypto traders we should favor liquid cryptocurrency markets.
1. Cryptocurrency Liquidity Makes Price Manipulation Difficult
Cryptocurrency liquidity makes them less vulnerable to market manipulation by dishonest players or groups of players.
As an emerging technology, cryptocurrencies currently have no clearly mapped-out path; they are less regulated and include many unscrupulous individuals looking to manipulate the market to their advantage. If you take a liquid, high-volume digital asset such as Bitcoin, controlling the price action in that market becomes difficult for a single market participant or a group of participants.
2. The More Liquid a Cryptocurrency Is, the More Price Stability and Lower Volatility It Offers.
A liquid market is considered more stable and less volatile, because a thriving market with considerable trading activity tends to balance out selling and buying forces.
As a result, whenever you sell or buy, there will always be market participants ready to do the opposite. People can enter and exit positions in highly liquid markets with little slippage or price fluctuation.
3. Cryptocurrency Liquidity Lets Us Better Analyze Other Traders’ Behavior.
Cryptocurrency liquidity is likewise determined by the number of interested buyers and sellers. Greater market participation means increased liquidity, which can signal a shift or even a reversal in the market.
A larger number of buy and sell orders reduces volatility, gives us an overall picture of the market forces at play, and can help us produce more accurate and more reliable technical data. This puts us in a better position to analyze the market, make accurate forecasts and take informed decisions.
4. The Evolution of Cryptocurrency Liquidity
Futures markets have appeared for the most important cryptocurrencies, notably bitcoin and Ethereum. Futures markets let investors trade contracts, or agreements, to buy or sell cryptocurrencies at a pre-agreed future date, easily and transparently.
They allow investors not only to buy and hold a future claim on an asset such as bitcoin, but also to short-sell BTC through futures contracts, which means you can short (sell short) bitcoin without owning any. The market makers of these futures contracts have to manage their own risk by providing cryptocurrency liquidity, which strengthens the overall liquidity of the market.
Measuring Cryptocurrency Liquidity
Unlike other trading-analysis indicators, liquidity has no fixed value. As a result, it’s difficult to calculate the exact liquidity of an exchange or a market. However, there are indicators that can be used to measure liquidity in the cryptocurrency market: the spread, trading volume and market size.
1. The Gap Between Bid and Ask: The Spread
The gap between the highest buy price (bid) and the lowest sell price (ask) in the order book is known as the spread. The smaller the gap, the more liquid a cryptocurrency is considered to be.
If the market for a digital asset isn’t liquid, investors and speculators expect to see a wider bid-ask spread, which makes trading that digital asset more expensive.
2. Trading Volume
Transaction volume is an important factor in determining the liquidity of the cryptocurrency market. It’s the total amount of digital assets traded on a cryptocurrency exchange over a given period.
This indicator has an impact on the direction and behavior of market participants. A higher trading value indicates greater trading activity (buying and selling), which implies greater liquidity and greater market efficiency. A lower trading volume means less activity and low liquidity.
3. Crypto Market Size
The size of the market you operate in as a trader also needs to be taken into account. Normally, the larger the market size, the more liquidity there is. It’s nonetheless necessary to also account for bag holders (token hoarders). Indeed, if the majority of the tokens in circulation are held by a few whales (large holders) and those whales decide to move into the market without taking precautions, big price swings can occur, and this can influence the prevailing liquidity.
The size of the cryptocurrency market has grown more and more significant over the years. Indeed, the combined market value of all cryptocurrencies crossed the 1 trillion dollar threshold for the first time since early November, according to CoinGecko, reaching 1.02 trillion dollars.
Liquidity Pools and Order Blocks
1. Liquidity Pools: How to Spot Them?
You can easily spot liquidity pools thanks to the concept of order blocks — better known as Order Blocks (OB) and developed by ICT. These OBs correspond to price zones where you notice a cluster of larger or smaller sell or buy orders placed by various players, with enough volume to temporarily reverse the market. Order Blocks can be plotted on a chart as supply and demand zones in a very visual way. On top of that, they make it possible to define precise entry points and easy-to-set invalidation points (see Stop Loss guide). Essentially, liquidity pools — or Order Blocks — are the zones where price holds great interest for clear-sighted traders. Within an Order Block, those who inject liquidity do so according to a plan designed to realize profits over the medium or long term, which is why reactions on contact with these zones are especially powerful.
2. How to Identify Order Blocks on a Chart?
To do this, I invite you to head over right now to the chapter dedicated to Order Blocks in my Price Action course.
The Fair Value Gap and the Liquidity Range Candle
Fair Value Gap: Definition
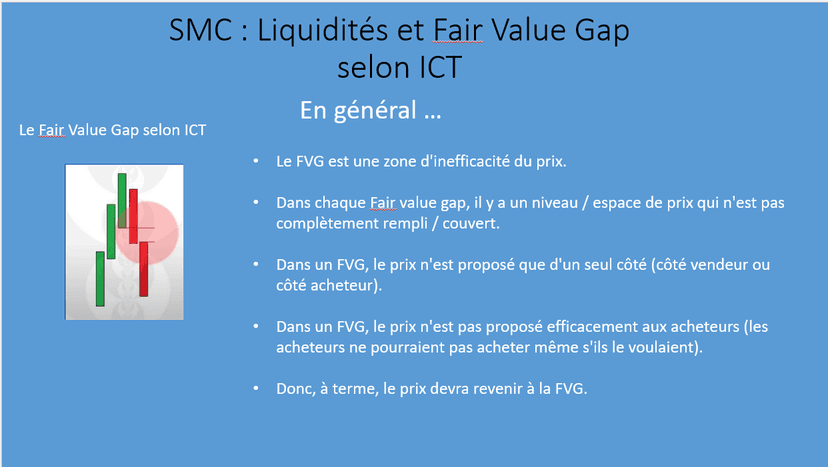
The Fair Value Gap (FVG) is one of the Smart Money Concepts developed by ICT. Also known as an Imbalance, inefficiencies, or Liquidity Void, it identifies the largest fair-value gap over a past trading period. People often speak of an institutional Fair Value Gap; these liquidity voids are mainly the work of institutions.
FVGs are sudden price changes that occur amid a lack of liquidity. Price will tend to jump from the original price level to the final price level, creating an “imbalance” in the price.
Price tends to fill or retest the Fair Value Gap zone. This would let traders understand at which price level the institutional players were active. The FVG zone is a fairly serious concept. It provides indications about the price zones where many orders are placed.
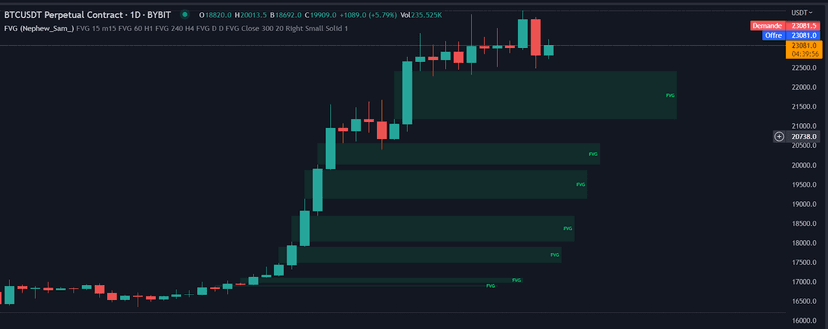
On TradingView there’s an indicator that highlights the most significant Fair Value Gap or Imbalance on the chart and plots the predicted future support and resistance levels based on the price action created at the FVG. A super simple yet effective way to obtain solid market levels that act as a magnet for price.
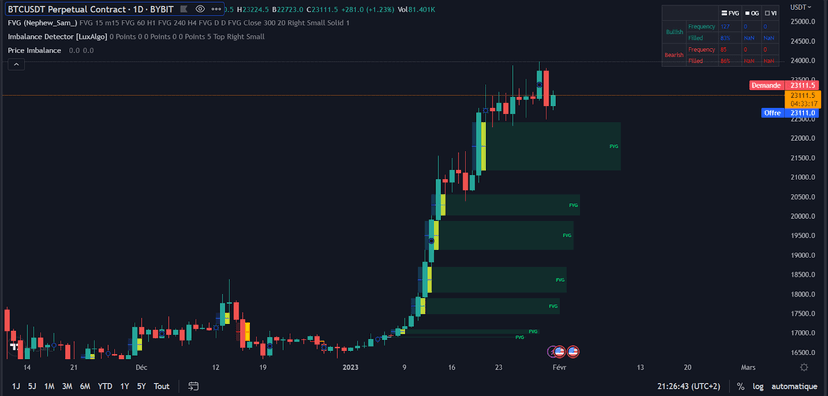
Here are other indicators that find Imbalances. You can clearly see here that the 3 indicators used (FVG, Imbalance Detector, Price Imbalance) highlight the same reality presented differently:
Liquidity Range Candle
The liquidity range candle is another trading concept used by the big market players, who keep price inside a specific market zone, thereby creating a tight consolidation zone. When price breaks through the “liquidity range,” liquidity floods into the market. It’s an easy way to grab the liquidity of retail traders (small individual traders). Stop-losses are triggered, breakout traders pile into the market and institutional traders absorb the liquidity.
Warning: If you don’t see the liquidity, you become the liquidity!
The break of a liquidity range is a sign of a breakout, a potential continuation, a retracement or a reversal. Always use this signal alongside an overall analysis of the market and of Price Action. It’s common for traders to also mark the 3 previous liquidity ranges and project them into the future. These empty zones can act as a future magnet for price, and a retest of them is very frequent. But if you witness a break above/below a previous range, that can also be a sign of a trend change. We also know that these liquidity ranges have been important levels for the institutional players, who may be willing to accumulate or distribute more orders at these levels (see the Wyckoff method).
What Is Kairos and How to Interpret It?
Kairos: the moment when the conditions are right for carrying out a crucial action; the opportune, decisive moment.
As a reminder, illiquid markets can become liquid, and liquid markets can become illiquid because of many different factors. It’s essential to understand that this is a dynamic market, and that even factors such as the time of day have effects on liquidity from one asset to another.
For example, with Bitcoin, we know that weekends are generally more illiquid than weekdays. We also know there are moments when liquidity can evaporate, for better or for worse. If a piece of FUD (Fear, Uncertainty, Doubt) is published and people suddenly become less interested in buying all at once, buy-side liquidity will vanish. This can trigger a dramatic drop in prices, because all the sellers dump into an empty order book.
The opposite can be said if the market is driven by FOMO (Fear Of Missing Out) and breaks away: sellers are no longer interested in current prices, and as their orders disappear, buyers push prices up dramatically.
A good trader must therefore become attuned to Kairos: through daily, systematic analysis of Price Action, they must eventually come to feel which is the most opportune moment to trade, and be able to avoid trading for the sake of trading, because “Knowing how to refrain from trading is also trading.” And this precept holds true for liquidity as well: no trade without liquidity.
Final Thoughts on Liquidity
Far from being exhaustive, in this introduction we’ve tried to give an overall tour of the concept of liquidity, which is heavily used in trading. None of the concepts described here — notably the FVG or the Order Block — originate with me. As you know, the foundation of my trading is the study of Price Action. That doesn’t stop me from using certain concepts drawn from ICT that I find highly relevant for explaining certain aspects of how PA develops. In fact, ICT didn’t reinvent the wheel; he created a new vocabulary out of older concepts. His merit perhaps lies in having synthesized and systematized them. Liquidity is one of the most important things to consider before taking part in a market. A good trader needs to know how to assess the signals that reveal changes in the volumes of liquidity being traded, and what they mean for their trades.
Every guide here is free. Browse the full course and join a community of traders who share ideas every day.