After my tutorial on the trading plan, here is my tutorial on the Trading System and Strategy. If you still find it a little tricky to tell them apart, I invite you to reread my course/tutorial on the trading plan. I’m taking this article as a chance to clearly distinguish between the trading journal, plan, system and strategy, which are all essential elements for every pro trader!
Trading System: What’s the Point?!
By definition, a trading system brings together the rules and principles that govern a trader’s approach when they are about to trade on a financial market.
A trading system therefore sets out the types of trades a trader can make, the markets they can engage in, the specific configurations and structures on which positions can be based, risk management, the rules relating to times of day or trading sessions, etc.
This list isn’t exhaustive. It’s up to you to add to it!
There is certainly a whole range of possibilities when it comes to how much precision a trader can give their approach.
Some trading systems simply give general guidance on setups and risk, then leave the rest to the trader’s discretion.
Others offer far more than that. Which one you choose depends largely on your preferences and experience. We’ll come back to this later.
The Advantages of a Good Trading System
A good trading system defines the conditions under which a trader is most likely to be profitable and shows the best way to exploit those conditions.
A good technique actually consists of finding opportunities that show an asymmetric Risk to Reward on high-probability technical structures. This means precisely defining your risk before and after you enter your positions.
A well-tuned trading system highlights profitable structures, when and where they form, and how to trade around them ( and also when to avoid them ).
The idea, if you want to understand the value of a well-crafted trading system, is this:
Trading is a very difficult activity. Yet it remains very easy to make decisions on a whim. Your trading plan acts as your conscience, that guardian angel who tells you:
“ Hey, hey, what do you think you’re doing?! …
… Well, maybe, but first WE CHECK. Rules are rules! “
Instinct — the kind that comes with years of experience — is excellent …
The kind that comes after a few days or a few weeks is a very different story!
Conversely, a disorganized trader isn’t profitable! Some may appear to be, but if they are profitable, it’s because they’ve built a solid trading system.
A trading strategy in two words: discipline and organization
The Foundations of a Trading Strategy
To have the tools to define a solid trading system, it’s essential to meticulously log your positions — fictitious ones first ( backtesting ) then real ones.
Also, don’t try to reinvent trading every morning, because otherwise you’re dead …
I do sometimes (rarely) add indicators to my panel of potential signals, but the fundamentals are there!
Throughout my courses, I always encourage you to be as independent as possible, to think for yourself and to keep a contrarian mindset so you can constructively question what you learn.
That said, when it works for me, it should work for you too, so at the start don’t hesitate to borrow what works according to me and other traders, and simply check it! This will give you leads that you can, with experience, refine.
Record every one of your moves on the markets and build your own paradigm, your own algorithm — but don’t stop there!
To be honest, it’s only once your win rate is high enough to be profitable that you’ll be able to build a system entirely defined by your own experience! Stay humble …

It’s entirely possible to build a model, the skeleton of a trading system derived from what you’ve learned from other traders, and to build your log, gradually add optimizations to it and customize it to your needs and preferences.
This is generally what I recommend to beginner traders who aren’t quite sure where to start. I also recommend this method to intermediate traders who feel they’ve wasted too much time piling up bad experiences.
The advantage is that you don’t have to (re)invent anything and, if you choose the right sources, you’re building on a solid base of trading principles.
The risk, of course, is picking clowns and basing your rules on the fairy tales they teach. That’s another topic, but any decent critical thinking will usually steer you in the right direction.
Look for people or groups who are credible, transparent, capable, and whose methods work according to your own testing.
What’s more, whatever you’re trying to do … it has to resonate with you! There’s no point trying to apply something you don’t understand, because if you move forward blindfolded, you don’t stand a chance.
Even assuming your copy trading works for a while, if the guy whose trades you’re copying retires, do you retire too?
That’s exactly why all the trading plans I share within my ongoing course are educational! I explain them so that:
1. you can save a considerable amount of time finding opportunities.
2. you understand why and how I stepped in to gradually build in my method.
Key takeaways:
1. How rigid your system is can vary … with time and success!
2. A good trading system is essential to reduce the influence of emotion on your decision-making.
3. A trading system is always based on the combination of your own experience and that of other traders.
How to Build a Trading Strategy
As suggested in the introduction, the form and content of a trading system or strategy will vary. That said, a solid foundation is essential.
So here is the typical content of a trading system “put down on paper”. It’s neither exhaustive nor perfect. That’s why I invite you to complete it with your own rules.
The best trading strategies are the ones that suit you and your personality!
I. Your Trading Style
Picture your system as a tree whose top starts from your trading style.
Indeed, depending on whether you want to scalp aggressively or swing trade with low risk, most of your system will be different.
The idea is to define the type or types of trading that speak to you (or that work), the time horizons and holding periods you’re comfortable with, etc.
Example of a trading-style definition: I’m mainly a directional, swing-ish intraday trader. I trade using support/resistance.
I enter at reversal points with a well-defined risk. I trade from one level to the next. (Level to level) I trade setups that generally let me know quickly whether I’m right or wrong. I don’t like holding positions for more than two or three days.
This example may work for you and not for others. It’s up to you to find the style that suits you — it’s very important for what comes next.
Maybe you’re a trend trader who doesn’t really care about exact entry points, and you might use a set of indicators to tell you when to get in or out. Perhaps you don’t worry about reversal points and simply want to capture the bulk of the move, happily holding a position for weeks or months.
Here are a few points you can consider to describe your style:
- Which combination of timeframes suits me best?
- Are you psychologically able to open and hold a position long enough to test your strategy?!
- Can you stand being underwater on a position for days or weeks in the hope of catching a broader trend on the options market, for example?
Or do you prefer to enter and exit the market more frequently based on specific intraday structures?
Besides, you can only find out what works for you by checking!
You can call yourself a scalper as much as you like, but until you’ve verified it, it will carry little weight in your profits anyway. Often, in fact, we think we’re suited to one style when a different or even completely opposite style is the one that fits us.
Also, there can be more than one answer to these questions. Your trading style doesn’t have to be 100% fixed (even though it would probably be useful, at least at first).
For example, many swing traders can also scalp effectively using the same techniques, simply applied to lower time horizons. Despite this overlap, as we mentioned, it’s better to start with your strength and expand your arsenal afterward.
Finally, know how to set your limits — sometimes the market is so hard to trade that it’s better to wait patiently and calmly prepare for what’s next.
II. Risk Management & Trading System
If you already know me a little, you know just how central risk management is to my method and my courses.
If you haven’t heard of it yet, that’s no problem at all, because I’ve made 2 tutorials on the subject precisely to help you quickly master your risk management!
So here is a first written tutorial on risk management and a second video tutorial on risk management!
Once you’ve defined your style or styles, defining your risk management is the first thing to do, without hesitation.
There will most likely be no reason to worry about anything else if you start out wanting to go all in …
Here, I won’t dwell on risk management again, because I’ve already done that.
Here are, nonetheless, 5 essential points of risk management:
- How much am I able to devote to my trading without it disturbing me psychologically in my decision-making? Don’t put yourself in financially difficult situations, because it will immediately show up in your results. On the contrary, if you take your time and your risk is measured, you’ll surely be inclined to make optimal decisions and avoid FOMO, for example.
- What share of the capital I’ve allocated to trading am I willing to stake on each trade?! Personally, I recommend starting with a risk of 1% MAX per trade ( careful, this doesn’t mean you stake 1% of your capital but that you risk 1% of your capital See the Stop-Loss Tutorial )
- What’s the plan when I’ve messed up several times in a row; what will my reaction to defeat be, and what’s the optimal process to respond to it and come back stronger?!
- What is my Risk to Reward, known as R:R?! Will I take high-probability trades with a low Reward, or will I rather take significant risks to ( hopefully ) win more?! I recommend quality setups that offer a minimum R:R of 1:2.
- Don’t hesitate to re-specify your risk according to the “TFs”.
> What is my max loss per day, per week, per month, etc.?!
It’s essential not to charge back in right after taking a hit that’s left you dazed … This kind of rule helps us with that!
That’s a solid base, but don’t forget the existing tutorials — they’re far more complete and tell you more about the method I’ve developed.
III. Position Entries and Exits
A. The Entry
Here it’s clearly about defining how and why you’re going to take a trade. Some professional traders perform fundamental analysis before looking at an asset, but what matters above all is technical analysis!
Obviously, this section is essential. It’s also the one that remains the most “customizable”. Some are able to specify an ultra-rigid rulebook here, with a multitude of technical indicators and stock indices to support their decision. While other traders will leave many elements to their discretion when it comes to entering a position
There’s no perfect solution. However, it’s certain that the best start with an ultra-rigid version. In the end, you keep an optimized framework, lighter and allowing faster decision-making.
Here are a few criteria and combinations that can be built into your trading system in order to enter a position:
1. What Should You Look At and See?
What should I notice to take a setup into consideration; which combination of signals makes my decision instantaneous?!
Examples of indicators that let signals converge in order to obtain interesting entry points:
- Support & Resistance levels ( see S/R YOUTUBE TUTORIAL )
- specific price-curve configurations
- Fibonacci levels ( my most-watched YouTube tutorial )
- Specific MA levels ( Moving Averages )
- Chop Index ( my favorite indicator )
- Open Interest
2. The Characteristics of the Setups You’re Looking For.
Are you able to literally draw a sketch of the perfect setup?
If not, you still have work to do, because it means you don’t even know what you’re going to look for. And please don’t get stuck on a single setup …
Put all the odds on your side by anticipating every plausible scenario!
Don’t hesitate to take a moment to make nice drawings to train your visual memory, because after a few years, I can assure you you’ll see the setups coming at a single glance. After a few years, in fact, discipline will mostly prompt you to verify your intuitions. Be patient — put in a few months full time first and it will come.
3. The Timeframes
Which timeframes are you going to use to identify (and refine) the structures you trade?
Which combinations?
Can each setup be traded on every timeframe you prefer?
What’s the minimum timeframe to seriously consider a setup?
4. The Trigger
What type of order will I place depending on the setup once it’s confirmed?!
Limit or Market Order ( I recommend the first in 99% of cases )
At which level of my structure should I place my orders?
Will I enter in several tranches, gradually, or at one specific level?
If I focus on a single entry point, what price movement is required to enter, and on which candlestick pattern?!
To conclude briefly on entries, what you need to remember is that it’s really about defining what to trade and how, what it looks like, how to enter a position and finally how to exit it and take profit ( see the Take Profit Tutorial )
In fact, the entry is defined at the same time as the exit …
If you’ve never used financial products or haven’t yet traded on the stock markets, I recommend you create a demo account and trade for free!
B. The Position Exit
So, likewise, which levels are you targeting and why are you targeting them?!
Are they discretionary, or are they clearly defined by the right setup?
Which indicators, and in which configuration, prompt me to take my profits?
How far from the Support & Resistance levels should I exit to capture enough liquidity?
In this section I regularly add new elements, because after placing hundreds or even thousands of orders, you always notice new clues.
If you’re a beginner, unlike with entries, it’s better not to overload this part of your system. The idea is to start with exit rules that are simple to apply, to encourage fast and effective decision-making ( = free of emotion ).
To complete or even fully rebuild this section, I invite you to revisit my tutorial on the take-profit phase as well as my tutorials dedicated to setting up Stop Losses.
IV. Trade Management: the In-Between Is Actually the Hardest Part!
Indeed, trade management, or transaction management, is the moment between entering a position and exiting it — and it’s actually the hardest part, because it’s so often neglected. Defining your take profits at the same time as your entries isn’t natural for everyone. And when it comes to management, I can tell you it’s the same. Don’t take the use of a financial instrument lightly!
Let anyone who has never “panic sell” only to then watch a price explode raise their hand!
If you’re a beginner or currently in a phase of questioning things, here I advise you above all to leave nothing to chance.
Enough dithering — let’s now move on to a concrete working base:
- It’s entirely possible to spare yourself this phase and program 2 possible exits: 1 on the upside and 1 on the downside, plus a deadline. OR you decide to take trade management into your own hands. This may be tied to a setup that requires it, because it’s a 1st trade after a backtesting phase, or simply because you enjoy it.
- Define the specific timeframes on which you prefer to monitor your trades. It’s recommended to monitor how a setup unfolds on the same timeframes that let us anticipate it.
- Under what conditions is it acceptable to move my Stop Loss? Will you do it more to increase your risk or to reduce it?
- Under what conditions is it acceptable to move my Take Profit?
- Is it possible to take profits in a pyramiding fashion or with another specific method, and what should you watch for in that regard?
- Can my long-term bias influence intraday decision-making?!
If so, it’s essential to remember how you determined your bias and under what conditions it will be invalidated. Finally, it’s about anticipating how all of this affects the management of my trades.
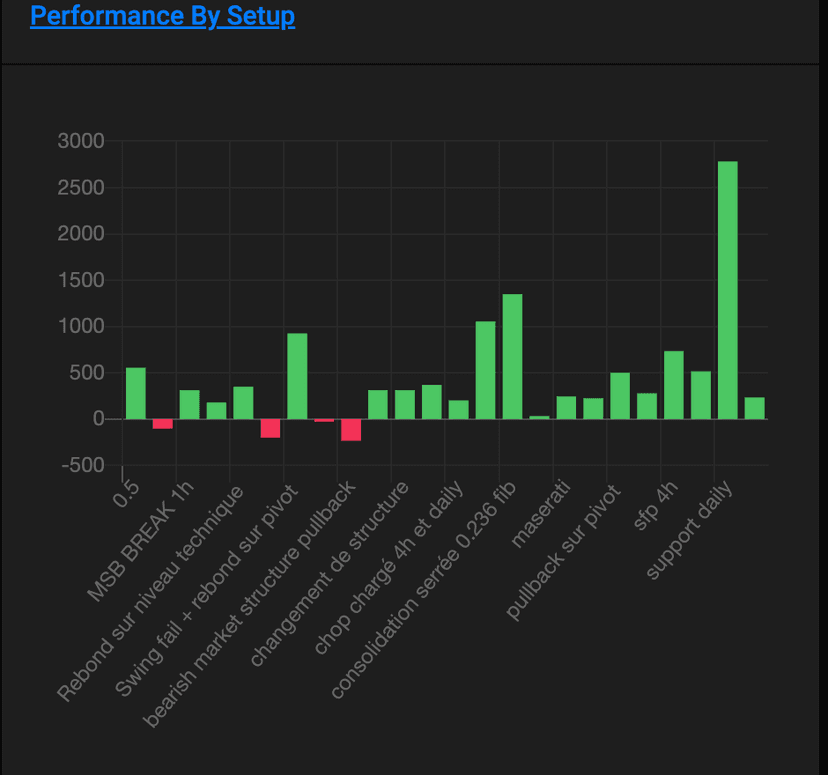
The important thing is to be meticulous in the way you record your trades; the best management practices will be drawn from your trading journal!
Don’t neglect it.
If you start getting into the habit of exiting too early, don’t hesitate to systematize your trade management to avoid emotional decisions and thereby optimize your win rate.
If, on the contrary, you regularly see nice gains turn into losing trades or ones hovering around break-even, that suggests a more interventionist management strategy (or more realistic targets, a better take-profit strategy, etc.)
Trading Strategy: A Practical Example
Now, I’ll walk you through a trading strategy designed to capitalize on market volatility while reducing your risk exposure through the effective use of a trailing stop. This method is especially suited to traders who want to maximize their gains during periods of strong price fluctuation while keeping tight control over their potential losses.
On the agenda:
- Selecting your coin
- What analysis to run to decide whether to open the trade
- The full setup
- Trade management
How to Select an Interesting Coin
To take advantage of volatility, it’s crucial to select highly liquid cryptocurrencies. I start by using Coinalyze to identify these coins, ranking the available options by descending liquidity. High liquidity makes it easier to enter and exit positions.
I then refine my selection by looking at the 24-hour price changes and the Open Interest, the latter being a key indicator of market activity for a given coin. The cryptocurrencies kept for the initial analysis include BTC, ETH, SOL, and others, favoring diversity to avoid overly obvious choices.
Technical Analysis on Coinalyze
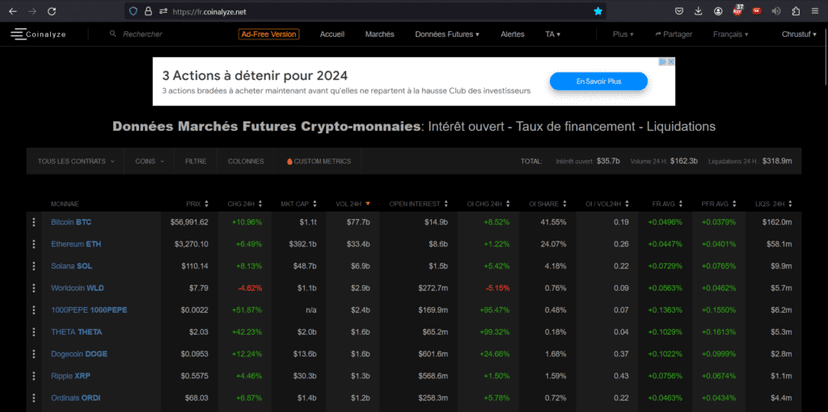
I sort my coins by descending liquidity, in order to bring the most liquid ones to the front, which gives me the following display
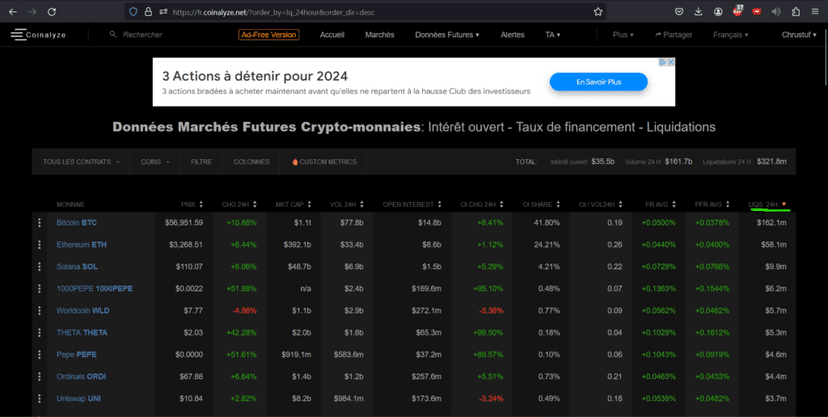
So I have the selection sorted by liquidity, and to build my coin shortlist, I like to check the 24h price change and the Open Interest.
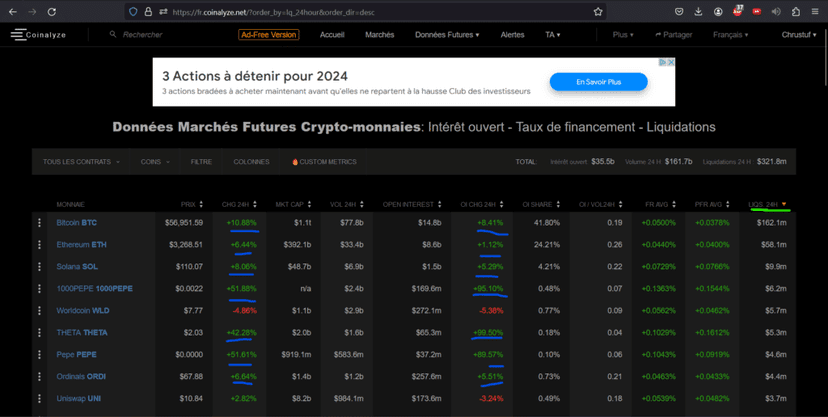
Using this method, our shortlist consists of:
- BTC / ETH / SOL / 1000PEPE / THETA / PEPE / ORDI / UNI
Volatility Analysis to Refine the Selection
To know which coins are the most interesting within the shortlist, I want to be able to compare the coins’ volatility against one another.
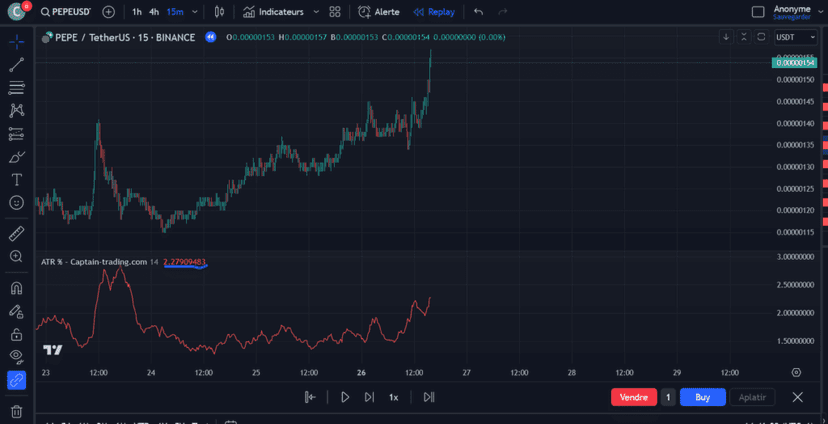
Here I use the percentage of the Average True Range (ATR) ( and not the chop index as usual ) as a measure of volatility to compare the cryptocurrencies on my list.
By the way, here’s a TradingView script to help calculate this indicator for each coin over 15-minute and 1-hour periods, suited to intraday strategies. In my TradingView guide, I tell you more about the programming language used by the platform.
//@version=4
study(“ATR Percentage”, shorttitle=”Captain-trading.com – ATR %”, overlay=false)
length = input(14, minval=1, title=”Period”)
atrlen = atr(length) / close * 100
plot(atrlen, title=”ATR in %”, color=color.red)
So I compare my ATR% between each coin on the shortlist over a 15m and 1h timeframe
Based on this data, I rank the coins from the most volatile to the least volatile, which allows a direct comparison and an informed selection based on the profit and risk potential.
Analysis Result | ATR% 15m / 1h
- SOLUSDT: 0.55 / 1.09
- THETAUSDT: 1.238 / 3.07
- PEPEUSDT: 2.26 / 3.28
- ORDIUSDT: 0.788 / 1.63
- UNIUSDT: 1.396/2.713
Ranked in order of most volatile:
- PEPEUSDT: 2.26 / 3.28
- UNIUSDT: 1.396/2.713
- THETAUSDT: 1.238 / 3.07
- ORDIUSDT: 0.788 / 1.63
- SOLUSDT: 0.55 / 1.09
Now that our shortlist is organized, it’s time to clean it up!
Technical Analysis
Directional assessment using Bollinger Bands
To further refine the list, I analyze the directional trends using Bollinger Bands. Specifically, I look at whether a cryptocurrency’s price is above the middle line (indicating an uptrend) and whether the bands are expanding (suggesting an increase in volatility). This double check helps identify the coins that are not only volatile but also likely to continue their upward move.
Working through our shortlist in order, we check the Bollinger Bands:
PEPE / USDT
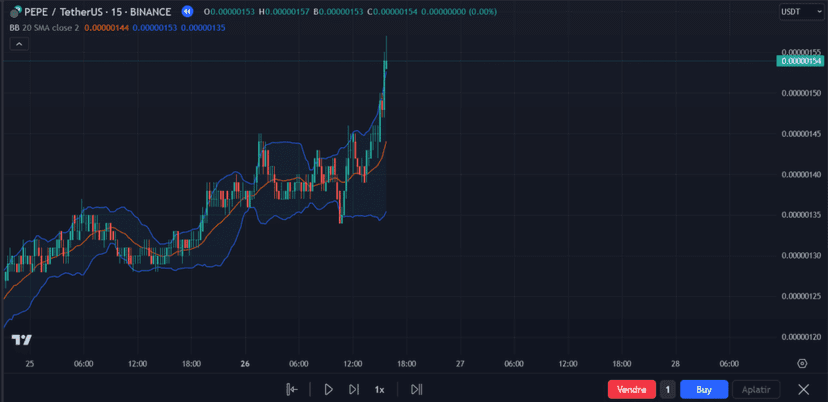
- Are we above the middle line? Yes
- Are the bands expanding? Yes
UNI / USDT
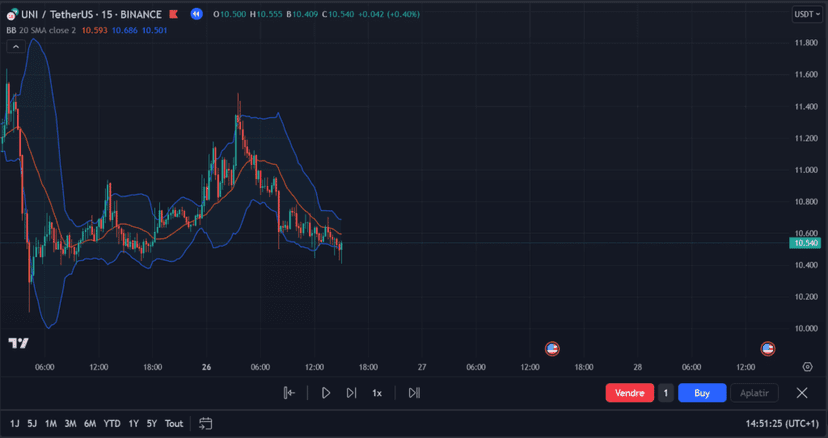
- Are we above the middle line? No
- Are the bands expanding? No
THETA / USDT
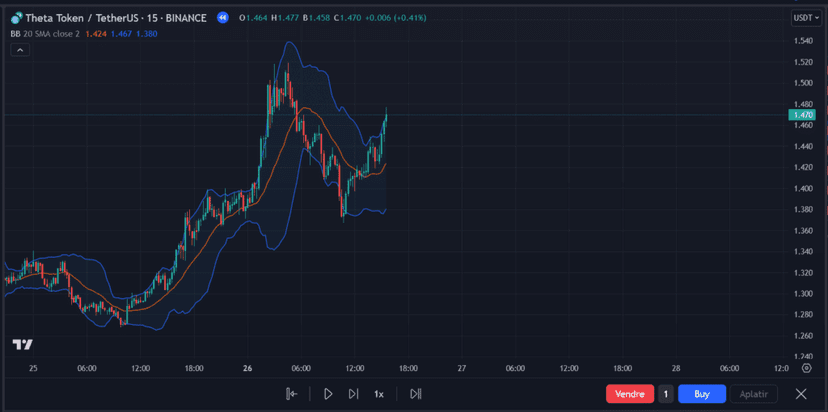
- Are we above the middle line? Yes
- Are the bands expanding? Yes
ORDI / USDT
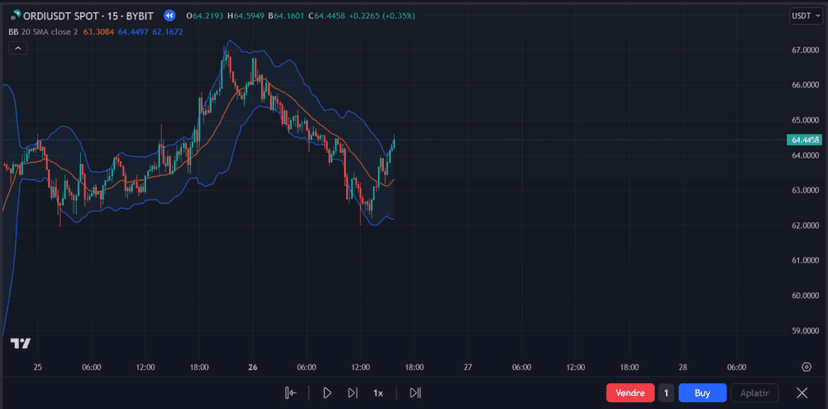
- Are we above the middle line? Yes
- Are the bands expanding? Yes
SOL / USDT
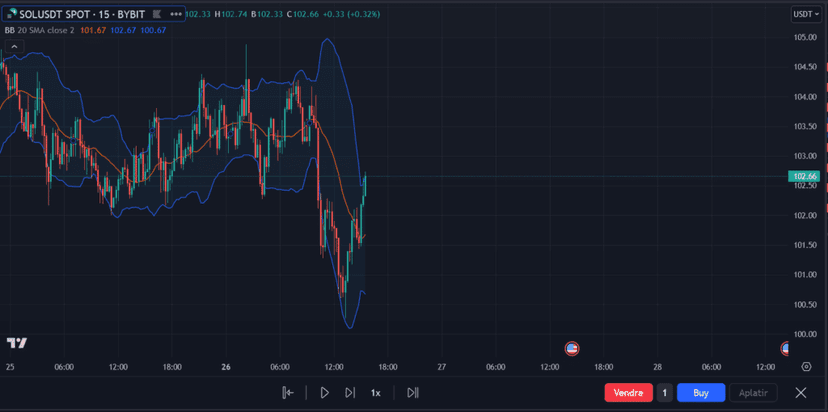
- Are we above the middle line? Yes
- Are the bands expanding? Yes
After filtering … So we can say goodbye to UNIUSDT; the shortlist therefore becomes:
- PEPE / USDT
- THETA / USDT
- ORDI / USDT
- SOL / USDT
Now that we have our selection of high-volatility cryptos, we can turn to our entry point!
Determining Entry Points Using Technical Indicators
On the selected coins, I determine the optimal entry points by watching the crossover of the 9 and 12 exponential moving averages (EMA), and I confirm the signals with the MACD and the RSI. A bullish crossover of the EMAs, together with a MACD above its signal line and an RSI that is high but not excessive, suggests a strong buying opportunity. Nevertheless, caution is warranted if the RSI indicates overbought conditions.
PEPE / USDT
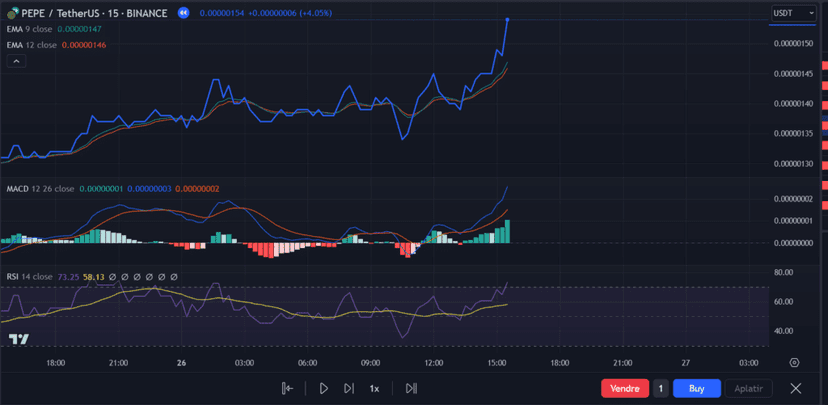
- Bullish crossover EMA9 EMA12 -> Validated
- MACD above its signal line
- RSI above 70 -> Strong probability that our bullish move is running out of steam!
THETA / USDT
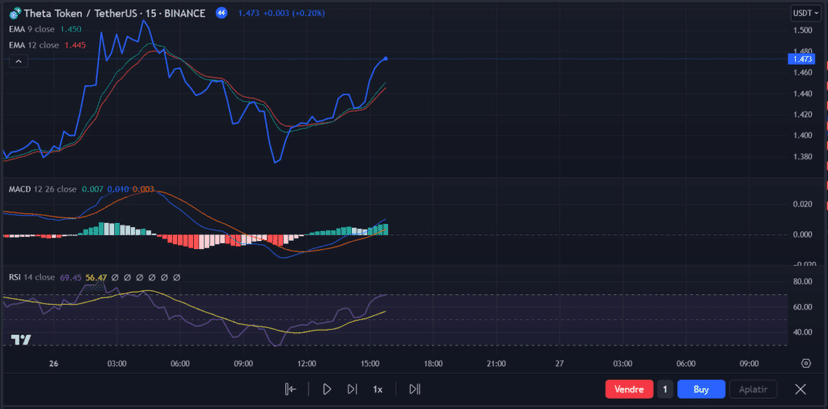
- Bullish crossover EMA9 EMA12 -> Validated
- MACD above its signal line
- RSI close to 70 -> Probability that our bullish move is running out of steam!
ORDI / USDT
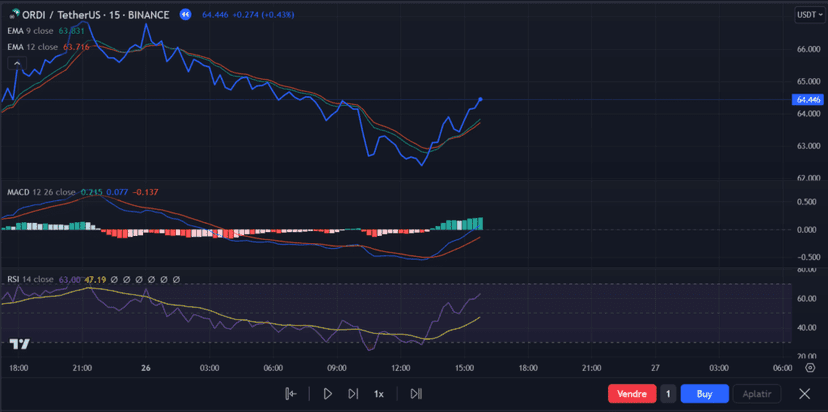
- Bullish crossover EMA9 EMA12 -> Validated
- MACD above its signal line
- RSI close to 63 -> Probability that our bullish move is running out of steam!
SOL / USDT
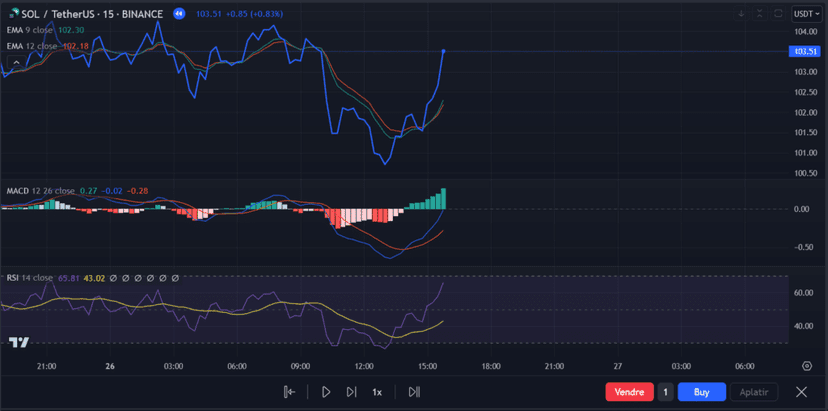
- Bullish crossover EMA9 EMA12 -> Validated
- MACD above its signal line
- RSI close to 65 -> Probability that our bullish move is running out of steam!
We conclude that our 4 coins seem to validate the criteria for taking a long position, even though the RSIs point to a potential slowdown in my bullish move.
The confirmation (or non-confirmation) of my analysis by technical indicators does not necessarily invalidate a trade; it does, however, lead us to think about the setup of our trade, which we’ll look at in the next point.
Analyzing the volume of the last wicks via the ADX
One last check: To give ourselves the best possible chance of reading the market correctly, we can over-confirm our analysis using the volume of the last wicks and the ADX indicator.
PEPE / USDT
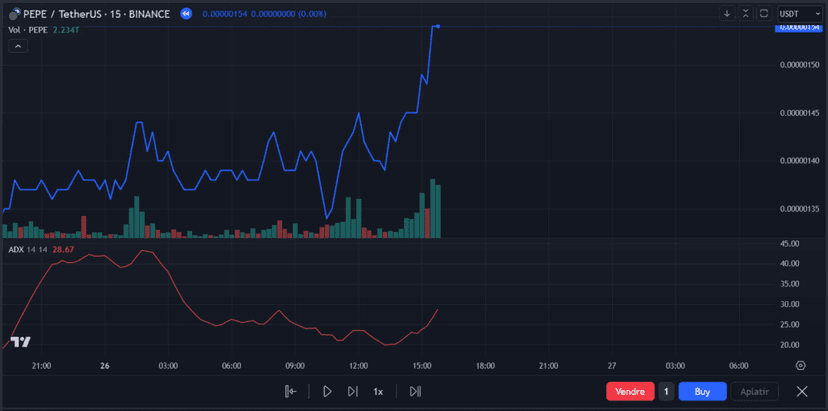
- Volume is rising
- The ADX is above 25
THETA / USDT
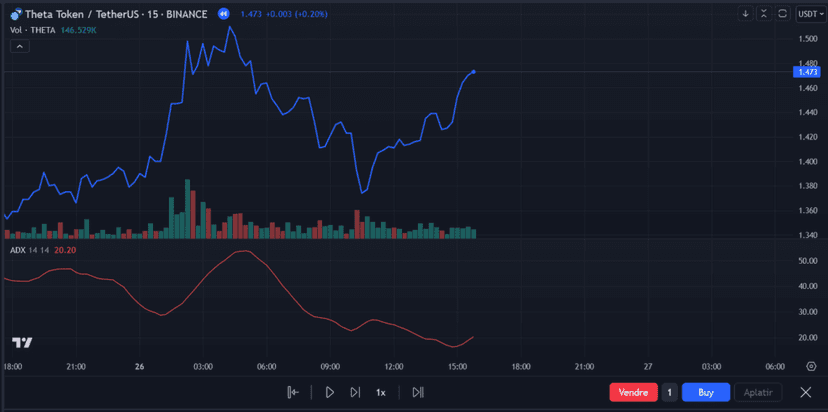
- Flat volume
- The ADX indicator is below 25
ORDI / USDT
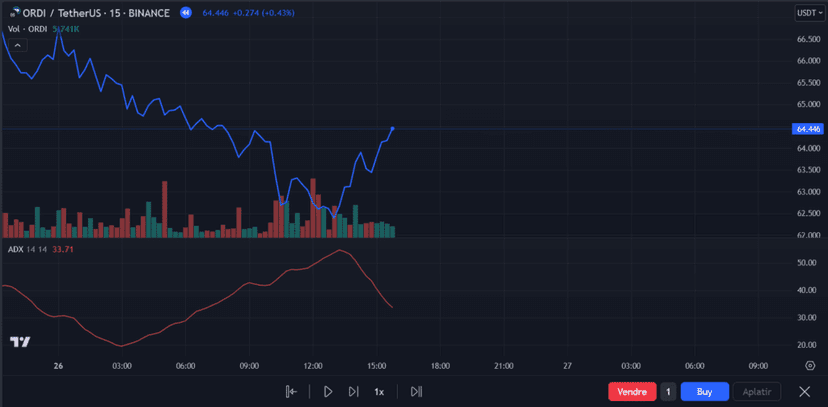
- Flat volume
- ADX above 25
SOL / USDT
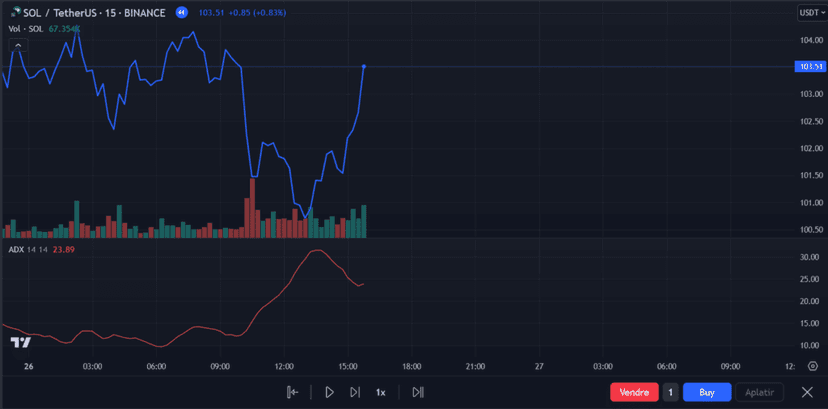
- Rising volume
- ADX below 25
Here, we’ll keep PEPEUSDT and SOLUSDT, which seem the most promising in our setup at the time of our analysis.
As for THETAUSDT and ORDIUSDT, you can invalidate them if you wish, but I’d rather advise you to set them aside and closely follow how they develop over the next candles which could validate a potentially interesting trade opportunity.
Now that our final coins are selected, we can place a buy limit order, preferably.
The Full Setup
- Entry points on PEPEUSDT: 0.00000158
- Entry points on SOLUSDT: 103.90
Your long positions are now open; it’s time to place your Trailing Stop sell order.
Trailing Stop: Setup and Management
After establishing the positions, it’s crucial to actively manage risk. I use a trailing stop whose ‘delta’ (the distance between the current price and the stop) is defined based on the coin’s ATR.
This delta is adjusted according to the volatility and market conditions specific to each cryptocurrency, thereby providing dynamic protection against unexpected market reversals. The choice of ratio used to set this delta is crucial and must reflect both the expected volatility and the trader’s risk tolerance.
At this point, I invite you to step back and look at your whole analysis: why you did this analysis, what the goal is, and whether we’ve demonstrated it?
Reminder: we were looking for high-volatility coins; the goal is to ride the wave on the upside while protecting ourselves on the downside with the trailing stop.
So we want to define a trailing delta that’s consistent with the coin’s volatility and — like magic … we can use the ATR (in nominal terms this time).
PEPE / USDT: ATR = 0.0000004
SOL / USDT: ATR = 0.57
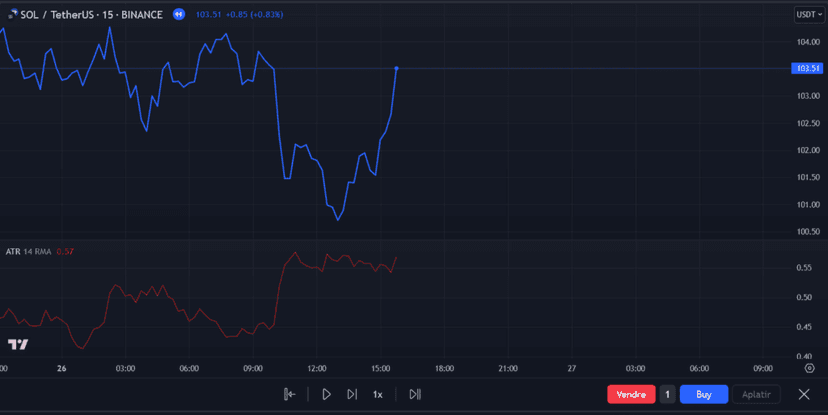
The RSI of both coins tells us that the bullish move may be running out of steam, so we’ll carry that over into the ratio we’re going to apply to define the Delta of the trailing stop.
Generally, I use the value of the ATR multiplied by a ratio between 2 and 3 to determine the delta of my trailing stop. The benefit is that my delta will be correlated to the market (thanks to the ATR) and the ratio I apply takes my conclusions into account.
The higher my ratio, the less sensitive my trade will be to large market swings, but my exposure increases just as much.
The lower my ratio, the tighter my delta, and so I risk triggering my trailing stop a bit early.
Let’s revisit our earlier conclusions to define the optimal ratio:
PEPE / USDT
- Are we above the middle line? Yes
- Are the bands expanding? Yes
- Bullish crossover EMA9 EMA12 -> Validated
- MACD above its signal line
- RSI above 70 -> Strong probability that our bullish move is running out of steam!
- Volume is rising
- ADX >25
SOL / USDT
- Are we above the middle line? Yes
- Are the bands expanding? Yes
- Bullish crossover EMA9 EMA12 -> Validated
- MACD above its signal line
- RSI close to 65 -> Probability that our bullish move is running out of steam!
- Rising volume
- ADX < 25
Strategic Reflection and Adjustment
It’s important to periodically reassess the strategy in place, taking into account how the market evolves and how effective the trailing stop being used is. If volatility and interest in the selected cryptocurrencies remain high, as indicated by the ADX and volumes, the position can be maintained. Otherwise, it may be wise to adjust the delta of the trailing stop or even close the position to preserve the gains.
In light of the conclusions, the RSI seems to indicate that the bullish move is calming down, even though the ADX and volume show that interest is still present.
So I’m going to “arbitrarily” set a ratio of 3 for PEPEUSDT (ADX>25) and a ratio of 2.5 for SOLUSDT (ADX<25)
Now we calculate the Delta
PEPE / USDT: Delta = 3 * 0.00000004 = 0.00000012
SOL / USDT: Delta = 2.5 * 0.57 = 1.425
So our sell orders will trigger if the level is touched at t0
for PEPE / USDT: 0.00000158 – 0.00000012 = 0.00000146
for SOL / USDT: 103.90 – 1.425 = 102.475
Our Stop Limit Orders will automatically follow if the price rises, keeping a gap equal to the Delta.
Initial t0
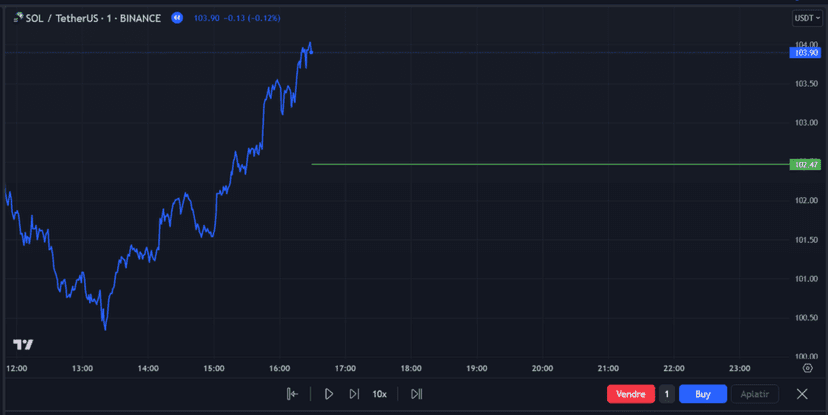
T1
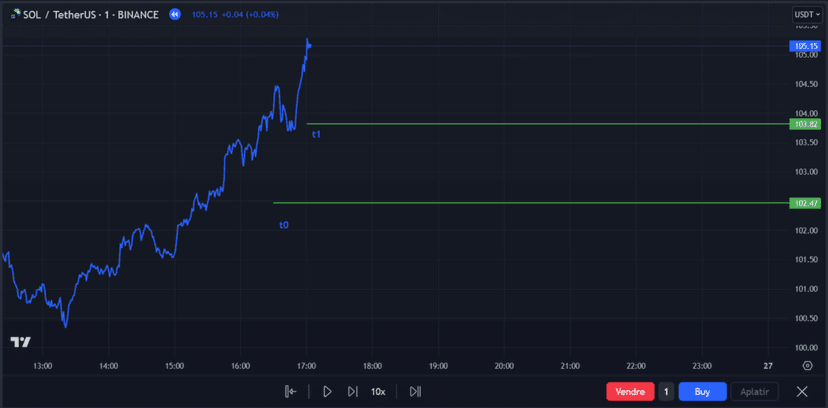
T2
T3
T4
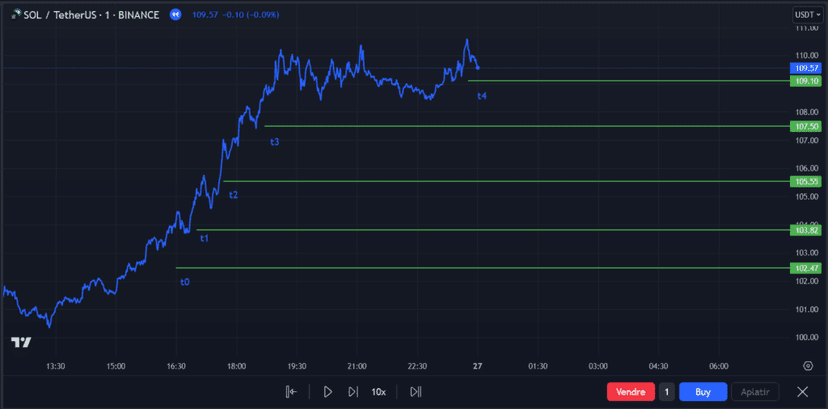
T5
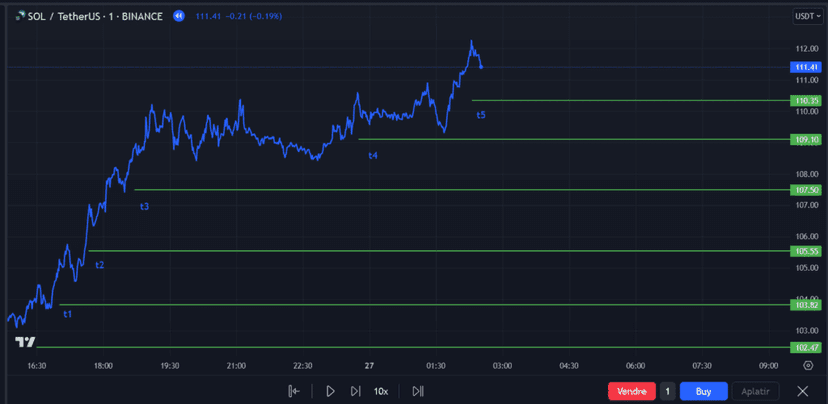
The trade plays out!
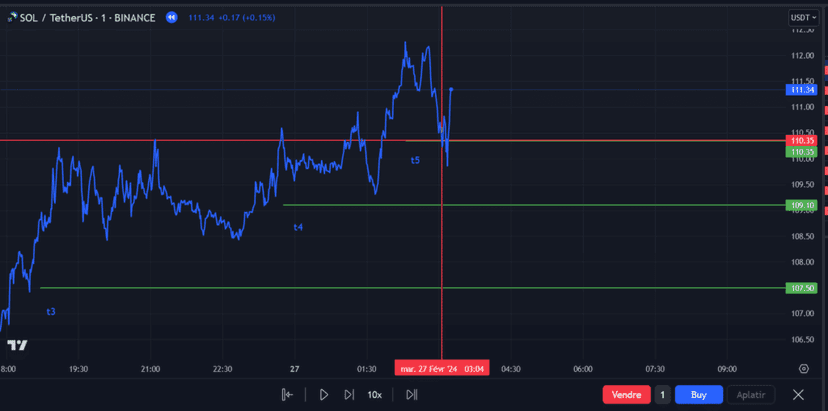
The trade finally closes at t6, because the price of 109 is below the trailing stop of 109.985.
The resulting PnL (Profit and Loss) from this trade is 5.10 SOL/USDT, calculated as the difference between the selling price at t6 and the initial buying price.
Examples of Effective Trading Strategies
Among the profitable trading strategies on the crypto market, for instance, there’s our famous break and retest. This strategy can be used in an uptrend as well as in a downtrend.
Range trading, which consists of trading within a horizontal channel, is much more accessible because it doesn’t require a trend in front of us. By the way, remember that 80% of the time an asset sits in a range. So if you master ranges, you’re set: you’ll have plenty of work!
If you’re especially patient, you can also opt for various options-trading strategies.
Profitable trading strategies are many, but their success will depend above all on your style — and be wary of automated trading systems if you’re a beginner. It’s only with a great deal of experience that you’ll be able to start defining your automated systems and strategies.
Within my free trading course, I offer you the chance to learn basic strategies through theoretical and practical lessons. Among them:
Curious how this two-legged options play actually works? My straddle guide breaks down entries, exits, and risk management step by step.
In Conclusion …
By building in a trading routine, you’ll not only be able to take advantage of the volatility in the markets you care about, but also effectively limit your exposure to adverse price movements. This methodical, data-driven approach lets you navigate the market with more confidence, exploiting uptrends while protecting yourself against sudden reversals.
Every guide here is free. Browse the full course and join a community of traders who share ideas every day.