The Captain brings you a free trading course every week. My goal is to get you familiar with my favorite trading strategies. So here is my Straddle course.
How can you make a profit without knowing where the market is headed next?
When the market stalls and consolidates, it is often hard to tell which way it will move next. Thanks to options trading, we no longer need to know whether the market is heading up or down, because we are going to bet purely on the volatility to come.
Strategies that speculate on volatility require you to bet on both a rise and a fall at the same time. That means you can be profitable no matter which way the trend goes next. The one condition for this to work is an “explosive” price move. This comes down to the exponential profit/risk profile that is unique to options!
Strangle vs Straddle: Definition
The purpose of this course is to teach you everything you need to know about the straddle in theory. On top of that, I will walk you through a concrete example so you can move on to practice quickly!
I will also share my tips for optimizing this very specific strategy, which calls for a certain amount of experience with options. If the topic of options is not yet familiar to you, I also encourage you to read my Put & Call Options course. It will definitely help you understand this strategy better by laying the groundwork, because here you will only get a partial overview of options!
As a reminder, the difference between a long straddle and a long strangle lies in the strike prices. Setting up a straddle means buying 2 options with a similar strike price. A strangle is more “flexible” since it does not require you to buy options with a similar strike price.
The Meaning of “Straddle”
“Straddle” (or straddling) translates into French as chevauchement, meaning “overlap.” This makes sense given the stacking — and therefore the overlapping — of 2 derivatives with opposite risk profiles.
Long Straddle: How to Set One Up?!
“Buying a straddle” means 2 position entries: 2 entry orders bought simultaneously!
- Step 1: Buy a Put ATM* (At The Money)
- Step 2: Buy a Call ATM (At The Money)
Both purchases must be made simultaneously at the same strike and with the same expiration date.
The ATM is the strike price; it must be as close as possible to your asset’s price at the moment you place your straddle.
In options trading, it is essential to refer to a curve called the Risk Profile. This curve lets you visualize your PnL and your risk based on the options you want to buy (or sell, in the case of a short straddle).
The Risk Profile of 2 options (or more) can be combined to form a risk profile that is unique to each strategy. For example, here in the case of the straddle strategy, the risk profile of the long Call option adds up with the risk profile of the long Put.
To help you make progress in options trading, it is essential to have a clear picture of your risk profile in mind. This is crucial for remembering and understanding what you are doing, and thus hoping that, for you too, it becomes second nature!
The Advantages and Strengths of the Straddle
- Theoretically unlimited potential profit
- Limited risk
- No need to have a bias: the trend doesn’t matter
Straddle: Drawbacks and Risks
- The trade has to be set up quickly: the opportunities are brief!
- The cost of setting up a straddle or strangle strategy can be significant
- Options are harder to master than futures and spot!
The main risk is miscalculating … your risk!
As explained further down, it is thanks to the risk profile that you can visualize your expected value and your maximum loss. The straddle is made up of a Long Call and a long Put; so their risk profiles add up to create a risk profile that is unique to the straddle. As you probably already know, risk management and calculating your break-even point are the first things to put in place if you decide to run any trading strategy whatsoever!
The Risk Profile of Options and the Straddle
Long Call
First, let me introduce the risk profile of the Long Call. The long call is a call option. This type of option speculates on an upcoming rise in price. The higher the price climbs, the more value the option gains.
Generally, an option’s profit curve looks more like an exponential function than a linear one. Below is, of course, a theoretical example!
Long Call Risk Profile
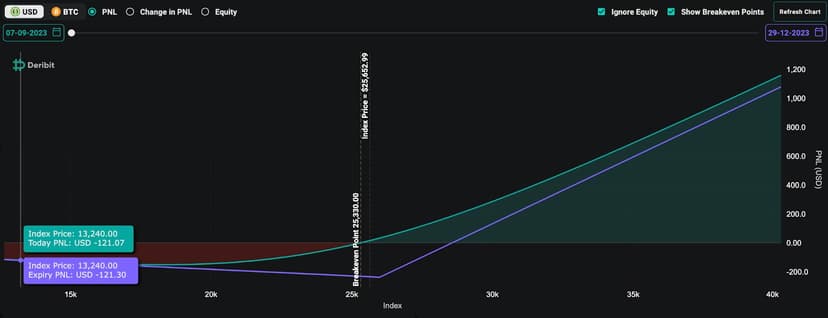
The green curve represents the possible loss and profit. The defining feature of the long call is the hope of unlimited profit driven by the price move. The loss, on the other hand, is limited to the price of the option. In other words, you can lose an amount somewhere between zero and the price of the option
Put Call
The Put option is a put option. By buying a Put, you are betting on a fall in price. If your asset’s price drops, your option gains value. In the diagram below, let me remind you of the risk profile of the long Put.
Long Put Risk Profile
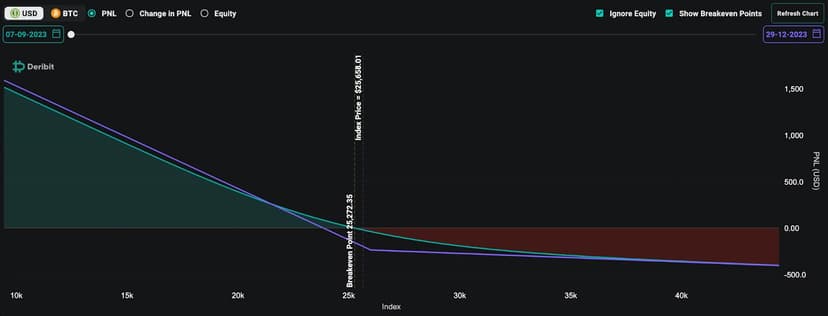
The green curve represents your potential loss and profit. The defining feature of the long Put is the hope of unlimited profit driven by the price move, while the loss is limited to the price of the option. The potential loss is again between 0 and the cost of the option.
Straddle: The Risk Profile
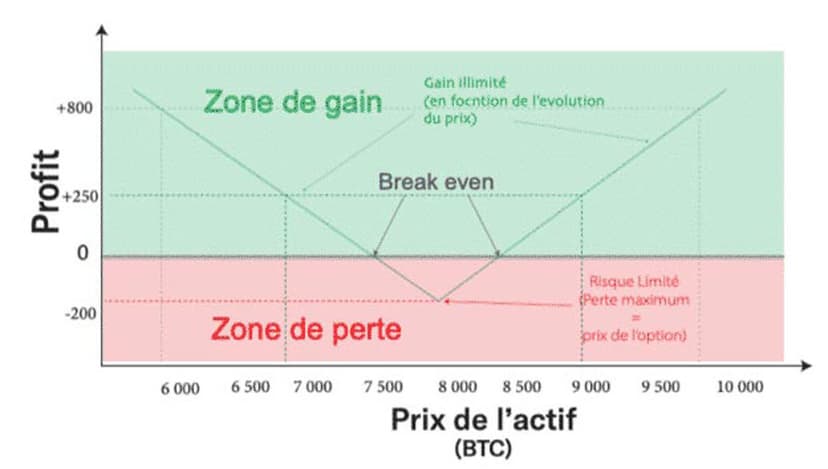
Since the straddle is made up of a long call and a long Put, the risk profiles of the call and the put add up to form a risk profile of its own.
Here too, the diagram illustrating the risk shows that it is limited. Our maximum risk is the price paid for the call option plus the price of the put option. According to the curve, the profit potential is unlimited as long as the price moves enough to the upside or enough to the downside.
You can also see that there are two possible break-even points. Indeed, if the price moves up, the price change has to be large enough to reach the first break-even point. Whereas if we see the price fall, it has to be big enough to reach the second possible break-even point.
Long Call + Long Put Risk Profile = Straddle Risk Profile
Straddle: How to Find a Good Opportunity
Implied Volatility (IV)* and Historical Volatility (HV)*
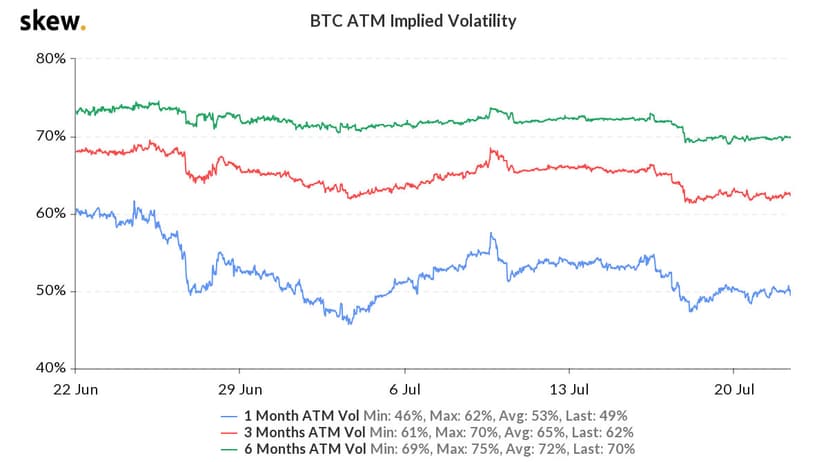
These metrics need to be at low values: the readings can be found for free on analysis sites like skew.com.
The IV is also shown in one of the columns next to the price of your option.
Implied Volatility, or IV *: (volatilité implicite in French) a measure used to quantify the expected fluctuations of an options contract over its lifetime.
Historical Volatility, or HV: (volatilité historique in French) measures the amplitude of price swings in a move, taking into account both upward and downward movements over a given period. To put it simply, historical volatility reflects how the underlying asset has moved in the past.
Note: the calculations behind IV and HV are complex. The key thing to understand is that in options trading, volatility is essential. The lower the volatility, the lower the price of the options. Conversely, the higher the volatility, the more expensive the options.
Depending on the strategy you are going to use, low or high values can be either an advantage or a drawback.
A Consolidation Phase
The larger the consolidation, the more explosive the next move will be. This is where Price Action technical analysis and “chart pattern analysis” come in, by pinpointing the consolidation phases precisely.
If you know my method at all, you know my passion for the Chop Index, the indicator that anticipates volatility! As with any technical indicator, remember that confluences are essential before drawing any conclusions. A technical indicator taken on its own is worthless! Sometimes 2 are enough on top of your Price Action technical analysis, but a single indicator is worth nothing.
The Price of Options
The cheaper they are, the easier it will be to reach your break-even point! As with any business, if your financial outlay tends toward zero, your profits will come quickly and your risk will tend toward zero as well! Options trading makes up 5% to 10% of total trading volume on traditional markets. It is estimated that in the crypto sector it is closer to 5%, because it is a relatively complex financial product, but also because the barriers to entry are far more demanding.
Timing
You need to give yourself enough time to be proven right before expiration. On the other hand, if you pick an expiration date that is too far out, it will be hard to pull off a profitable straddle. So it is all about striking a balance through good timing. Remember that trading is like chess: unless you get lucky, if you are not at least three moves ahead, you have already lost!
Tips for Setting Up a Straddle
Tip 1
To set up an effective long straddle, the volatility at the moment you place it needs to be extremely low. The price should have been flat or sideways for a good while; it should be at the end of a long consolidation. That will let you get a low price for your options.
To set up a short straddle, it will be the opposite: you short the volatility, so you are hoping it drops, that it contracts to a minimum!
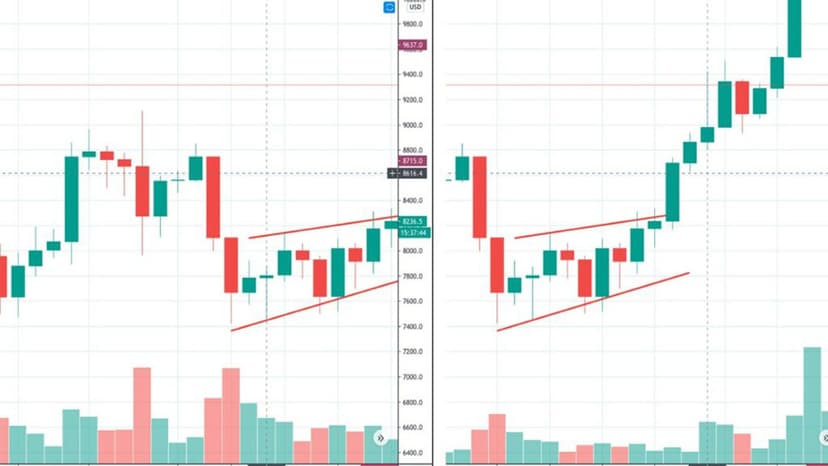
Trading Patterns like the Pennant, Bear Flag, or Bull Flag are my favorites for deciding whether a straddle can be placed.
The longer the consolidation lasts, the more profitable the straddle can be, because the move that follows is usually explosive: low-priced options + growing move potential.
Bear Flag Pattern | Example of a Profitable Straddle
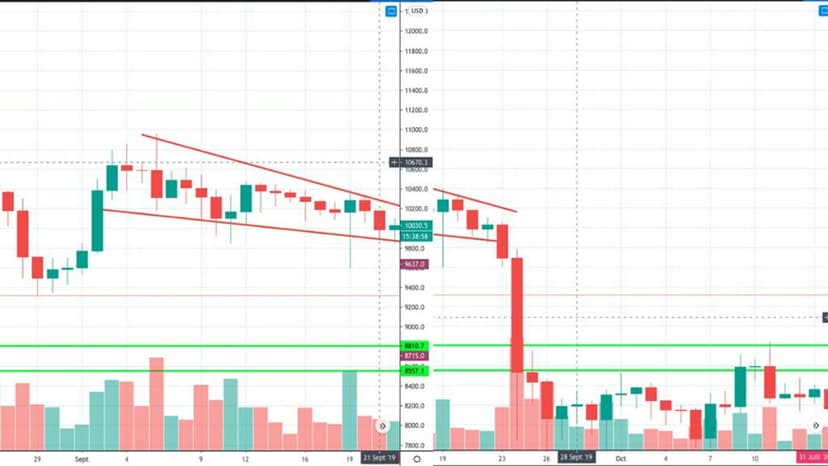
Bull Flag Pattern | Example of a Profitable Straddle
Tip 2
I rely on an invaluable technical indicator, the Choppiness Index. This technical indicator helps me determine whether the price has built up enough “energy” to break out imminently.
A value above 50 is already a good sign; above 55 it becomes optimal. Here are two examples that illustrate how reliable the CHOP is!
Chop Index and Volatility: Example of a Price Rise
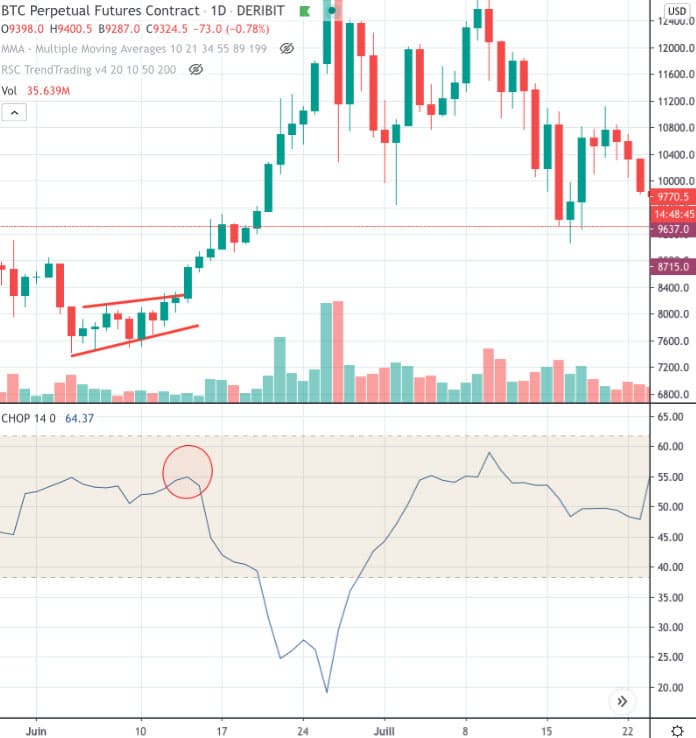
Chop Index and Volatility: Example of a Price Rise
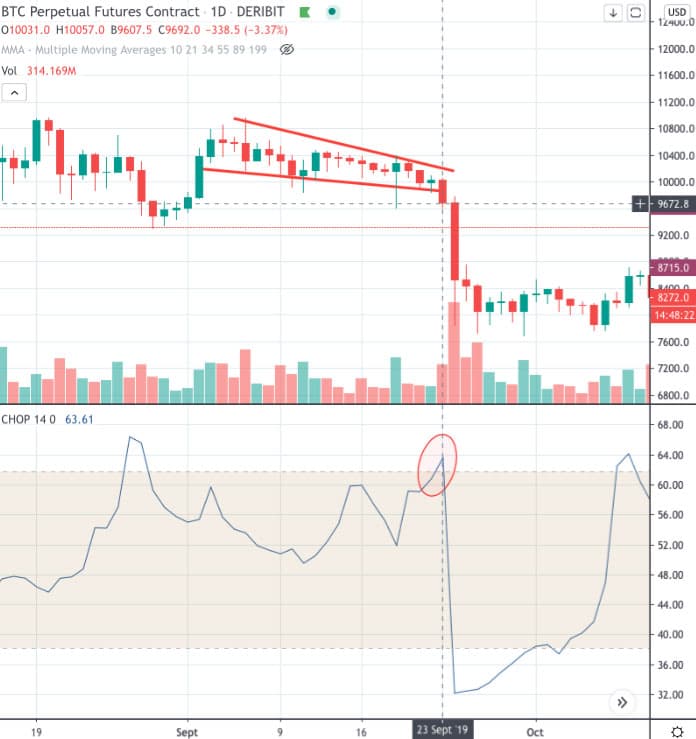
Tip 3
Two years ago, I also used analysis sites like skew.com to get as much volatility data as possible. As of today, I stick with TradingView, since Skew has shut down anyway!
These days, I have specialized in analyzing Open Interest on options combined with Price Action and the Chop to spot signals before confirming them through my analysis.
Tip 4
The crypto market is highly volatile — I am not telling you anything new… That is why I generally avoid holding my options until expiration. I do not hesitate to take my profits!
In other words, a winning position can quickly turn into a losing one before your contracts expire. . I set precise targets for myself and I always try to sell while the move is still strong, because strength also contributes to an option’s value! It is the law of supply and demand: when it goes up, the majority is long, and when it goes down, the majority is short.
Bonus Tip
Discipline in applying your method for checking the break-even is essential for placing every trade. Be precise and methodical!
By the way, keep in mind that most beginner mistakes in trading come from a lack of mastery of the crypto or other platforms you are working on. Always backtest your strategies before putting them into action, even if it means paper trading. And while I am at it, remember that I wrote a whole article to show you how to trade for free — or rather, how to learn for free and in a concrete way!
A Straddle Example on Coincall
I am now going to break down the strategy process step by step through an example on Coincall
! Find my guide and my review of Coincall right here!
Step 1
Calculating the cost of the straddle is done by adding up the purchase prices of the at-the-money Call and Put ( at the money )
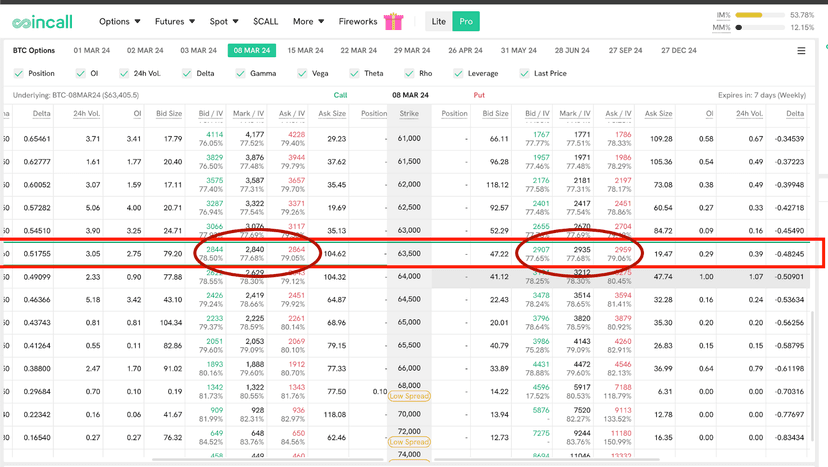
I decide to place a straddle whose options will expire on March 8, 2024, with Bitcoin at $63,399 at the moment I place my order.
In this specific case, the ATM contract is at 63,500, and the strike price is the one closest to the current BTC price.
To find the price of your straddle, you just add the price of your Call, roughly 2,855, and the price of your Put, $2,900. So $5,765 is the amount you will have to lay out to set up the strategy and control 2 full BTC. This sum is also equal to your maximum loss for this trade.
Bonus Straddle Tip: Never buy with a market order; place your orders as a “ Limit Order ”. This will save you from the spread, which can be high when liquidity is thin! That is common on an emerging market, so be smart, become a sniper! This advice applies to futures and spot as well, even though the spread will surely be smaller
$5,765 will therefore be the maximum loss for this trade. In this example, I chose to buy the full option. I could just as easily have chosen to stake 1/10 of the call and put contract and thus risk $576.
On COINCALL, the big advantage is that we could even have chosen 1/100 of a contract, and that becomes very affordable!
That is not the case on Deribit, for example…
Remember that the straddle is a limited-risk strategy: the price of the two options bought to run it.
So until the contracts expire on March 8 at 2:30 PM ( Paris time ), you will have speculated on the value of 2 Bitcoin: 1 BTC short and 1 BTC long.
Step 2
As with any strategy, it is essential to calculate your risk and your expected value before you even enter the position.
To do this, you need to determine whether the straddle can be profitable. Remember that the larger the price move, the more profitable the strategy will be, regardless of whether the price rises or falls. We simply need a large amplitude in the price move before expiry.
To do this, we need to refer to the Risk Profile. Thanks to these charts, we can instantly know at what point our strategy becomes profitable.
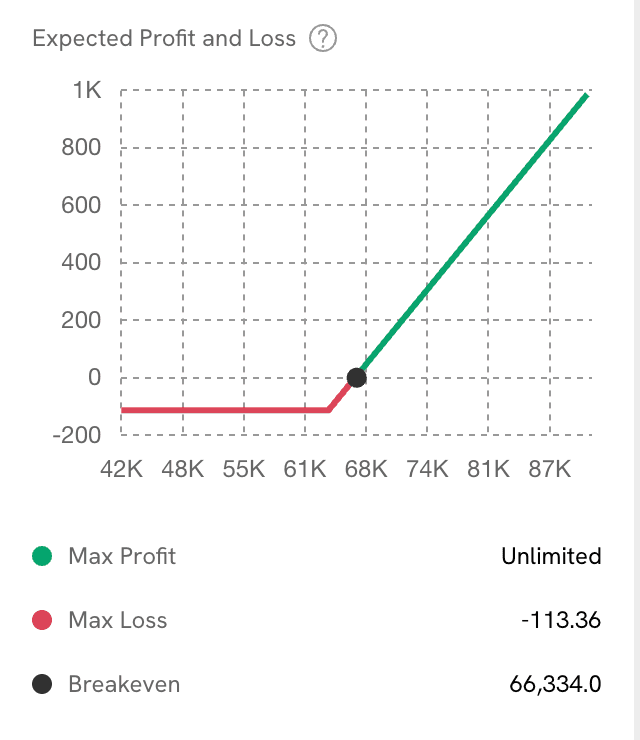
Risk Profile Diagram for Our Long Option
Risk Profile Diagram for Our Short Option
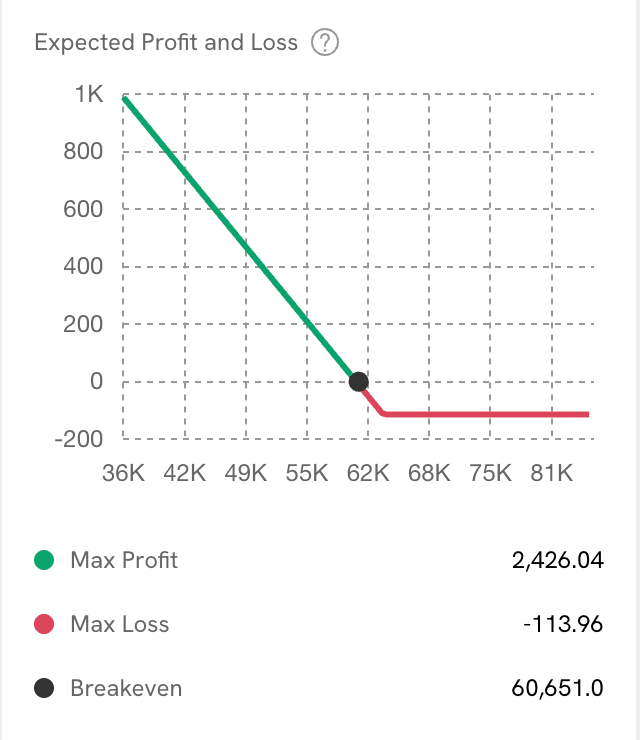
By entering the data into the table, the spreadsheet will draw this diagram .
Interpreting the Risk Profile
Based on the diagram, we can make out. The green part, which represents our Profit, and the red part, which represents our loss at expiration.
With this strategy you have two break-even points. Indeed, if the price expires at 62,500, our option is neither a winner nor a loser. It is therefore right at its break-even point. On the other hand, if the price expires at $64,000, we will be in profit!
On the diagram, our BE points today would be approximately 62,500.
Once a break-even point — the break-even — is crossed, your option becomes profitable once one of the two Break-Even points has been crossed.
Bonus Tip: Profits and losses do not take into account the fees for opening and closing the position. So do not forget to check them and add them up in order to determine the real risks.
Step 3
Ask yourself the following question:
“Technically, what are your odds of pulling off this trade?!”
In other words, be rigorous and objective in light of the tools at your disposal and what they tell you. You can lean on technical analysis using support and resistance.
Take advantage of the Captain’s perks on Coincall with a $20 bonus for a $200 deposit, plus a VIP group so you can follow our positions on the platform.
My Take on the Straddle Strategy
Options contracts are a bit like the cherry on top when you are a trader. In my view, they are an essential instrument for becoming an accomplished trader, diversifying, and smoothing out your risk and your profits!
Factors like volatility or the expiration date give us plenty of additional opportunities. This will therefore let you significantly increase your profit potential. The number of strategies and their complexity can range from simple to very complex. So it is important to start by studying one or two strategies at most in order to begin getting comfortable with the tool.
When it comes to options, you always have to think in terms of risk. Rigorously establishing the risk profile of each type of option beforehand will be very useful to you.
Although options offer certain advantages, they are not without risk. As a result, misusing them inevitably leads to losses, even limited ones in this particular case. If you miscalculate your risk, you run the risk of being liquidated, which is why a position calculator is so useful.
Do not trade options without a clear understanding of your exposure and without knowing your PnL precisely.
Personally, for my options trading, I really focus on Coincall, which is becoming the specialist in a market that all the exchanges are wary of. The big challenge is finding competent market makers who are willing to work on illiquid markets.
Another Straddle Example on Deribit
This example is much older, but it will probably still be useful to you! Let’s break down the process of entering a position together, step by step, through a concrete example on the Deribit crypto platform!
Step 1
Calculate the cost of the straddle by adding up the purchase price of the at-the-money Call and Put. I decide to place a straddle whose options will expire on July 24, with Bitcoin at $9,388 at the moment I place my order.
In this specific case, the ATM contract is at 9,500, and the strike price is the one closest to the current BTC price.
To find the price of your straddle, you just add the price of your Call, 0.0095 BTC (about $90 ), and the price of your Put, 0.02 BTC (about $190)
So 0.0295 BTC is the amount you will have to lay out to set up the strategy for 1 full contract. This sum is also equal to your maximum loss for this trade
$280 will therefore be the maximum loss for this trade. Remember that the straddle is a limited-risk strategy, and that it is limited to the price of the two options bought to run it.
So until the contracts expire on July 24 at 10:00 UTC, you will have control over 1 BTC.
Step 2
As with any strategy, it is essential to calculate your risk and your expected value before you even enter the position.
To do this, you need to determine whether the straddle can be profitable. Remember that the larger the price move, the more profitable the strategy will be, regardless of whether the price rises or falls. We simply need a large amplitude in the price move before expiry.
To do this, we need to refer to the Risk Profile. Thanks to this chart, we can instantly know at what point our strategy becomes profitable.
You have to manually fill in the values in the table I have made available to you, without forgetting to tick the boxes that correspond to your trade.
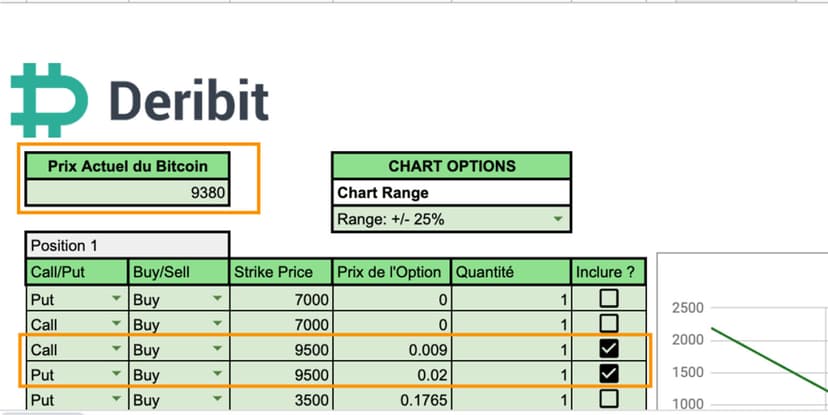
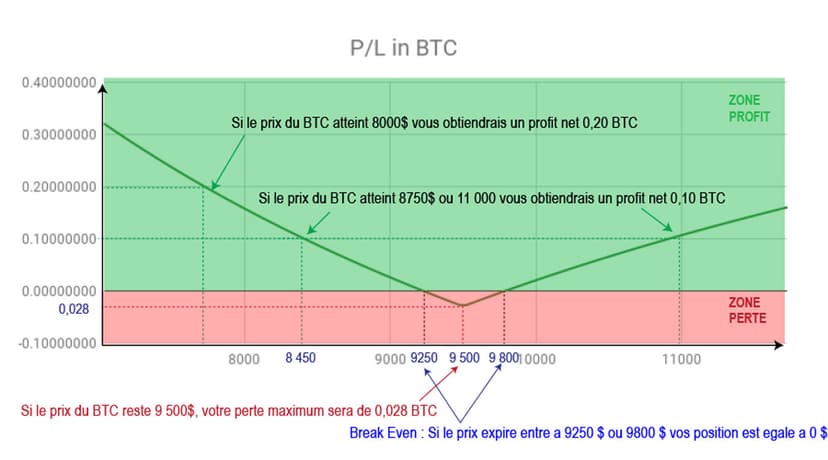
By entering the data into the table, the spreadsheet will draw this diagram.
Interpreting the Risk Profile
From the curve, we can see that our maximum loss is 0.026 BTC for a full contract. So if the BTC price stalls until the options expire, and stays at the same price as your strike of 9,500, your maximum loss will be equal to the price paid for your straddle, i.e. 0.028 BTC.
With this strategy you have two break-even points. Indeed, if the price falls and reaches $9,250, your option is neither a winner nor a loser, so it is at break-even. The same goes if the price rises to the $9,800 area.
Which gives you two Break-Even points.
Once one of the break-even points is crossed, your option becomes profitable once one of the two Break-even points has been crossed.
If the price reaches $11,000 and you sell your option, you pocket a net profit of 0.10 BTC.
Another example for reading the curve: if the price reaches $8,450, your profit would be 0.10 BTC.
In the same way, if the price reaches $11,000, your profit will also be 0.10 BTC.
The curve represents your PnL for the 2 contracts that make up your straddle.
That said, on Deribit you can take a minimum of 0.1 contract.
So your maximum loss is 0.0028 BTC. Your potential gains will also be divided by 10. If the price reaches $8,000, that will give you a net gain of $125.
NB: Profits and losses do not take into account the fees for opening and closing the position. So do not forget to check them and add them up in order to determine the real risks.
Step 3
Ask yourself the following question: Technically, what are your odds of pulling off this trade?! In other words, be rigorous and objective in light of the tools at your disposal and what they tell you.
You can lean on support/resistance technical analysis or on certain technical indicators.
In this example, there are only 2 days left before your contracts expire. That means the move has to be imminent for the trade to succeed.
Generally, I would tend to give myself at least a week or two for my plan to play out.
The further out in time you set the expiration, the more your straddle will cost you, which is why you have to be good with your timing, striking the right balance!
Every guide here is free. Browse the full course and join a community of traders who share ideas every day.