The Choppiness Index or Chop Index is one of my favorite indicators, quite possibly my number one. I use it every single day in my trading.
The Chop Index is a volatility or strength technical indicator developed by the Australian commodities trader E.W. Dreiss. What it actually does is tell you whether a market is trending or stuck in a range. Its readings fall between 0 and 100, with low readings pointing to a strong trend and high readings signaling consolidation. So the Chop Index belongs to the family of movement, or volatility, indicators.
And of course, you can pull up the Chop Index easily on TradingView !
Chop Index: An Energy Gauge
This indicator is built to determine whether the market is choppy or trending. It’s choppy when prices move in a disorderly way, and trending when prices move up or down. So it helps us measure the strength/energy that has accumulated, or spot when the move runs out of steam.
Careful! The Chop Index is a non-directional indicator. It wasn’t created to predict the market’s future direction. In other words, it tells you nothing at all about which way the move is heading next. It’s a piece of data to use solely to anticipate how significant the market’s volatility will be.
The core idea you need to grasp to properly understand how the Chop Index works is this: when it shows higher values, that indicates consolidation, whereas when it shows lower values, that means price action is moving in a bullish or bearish direction.
The higher the timeframe (TF), the more explosive the move flagged by the Chop Index is likely to be. A charged chop shows that consolidation is over and that an explosive move can come very quickly. The more discharged the chop is, the more likely the market is to consolidate before setting off on a new trend.
Chop Index: The Calculation
1. Sum the true range over the last n periods.
2. Divide by the result of the following two steps:
3. Calculate the lowest TrueLow over n periods.
4. Subtract it from the highest TrueHigh over the n periods.
5. Calculate the Log10 of the result, then multiply it by 100.
6. Divide the result by the Log10 of n.
Chop Index: Video Tutorial
The Mathematical Formula and How to Use It
CI formula = 100 * LOG10( SUM(ATR(1), n) / ( MaxHi(n) – MinLo(n) ) ) / LOG10(n)
When I read the Chop Index values, I usually complement them with Fibonacci ratios to define certain thresholds. Fibonacci ratios, which are part of the Fibonacci retracement levels, are obtained when a number in a Fibonacci sequence is divided by the number that follows it, or by a number two places to its right. Each number in the Fibonacci sequence is obtained as the sum of the two preceding numbers, as follows: 0, 1, 1, 2, 3, 5, 8, 13, 21, 34, 55, 89, etc.
So the 61.8% ratio is calculated by dividing a number by the one that follows it. For example, 34 divided by 55 equals 0.618, or 61.8%. The lower threshold of 38.2% is calculated when a number is divided by the number two places to its right. For example, 34 divided by 89 equals 0.382, or 38.2%.
A Chop Index value of 61.8 represents the upper threshold. At 38.2, it’s the lower threshold.
The Chop Index and Market Phases
There are two major phases in any market:
- The consolidation and compression phase
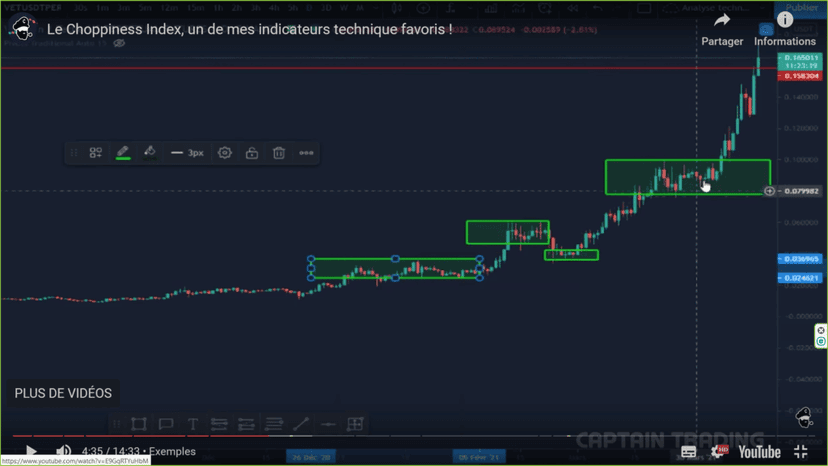
The green rectangles here represent consolidation and compression phases — in other words, ranges.
- The trending expansion phase.
In the previous chart, price action also shows trending moves: between the first and second rectangles, for example, you can see an uptrend, whereas between the second and third there’s a small downtrend, even though the overall trend, if you look at the whole chart, stays bullish.
An asset is therefore constantly moving between these two phases: the first reflects a certain choppiness and uncertainty on the market’s part, while the second reflects a willingness to follow a bearish or bullish trend.
To better spot the pivot points and anticipate the moments when price action is most likely to shift from one phase to another, we can lean on the Chop Index. So here’s a simple way to interpret the values the Chop Index gives you:
- If it’s above 61, it signals that a strong move is imminent: a charged chop.
- If it’s below 38, it usually signals that the trend is running out of steam and that a correction/consolidation is about to arrive and set in: a discharged chop.
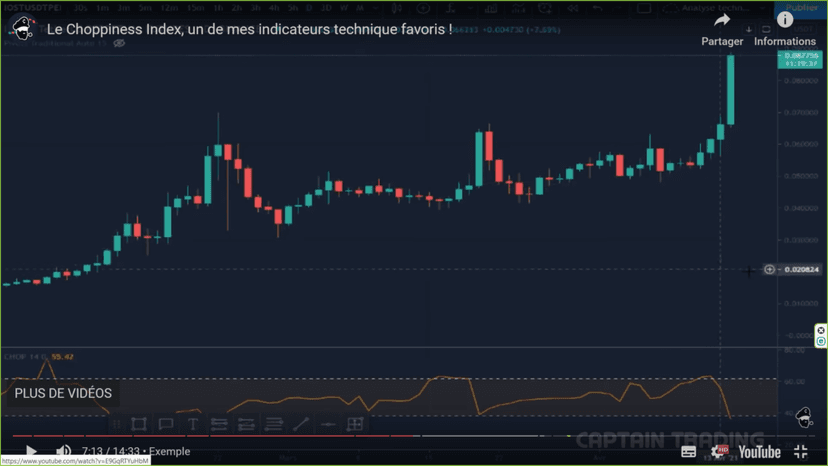
In this example, you can clearly see a charged chop announcing an explosive move, and discharging immediately afterward.
Careful! This technical indicator won’t factor in FOMO. If investors get carried away, the chop could very well stay discharged while price keeps climbing!!!
Chop Index: A Practical Case
Chop Index: Kryll Video Tutorial
For more trading & indicator courses — indicators I use every day in my technical analysis — feel free to check out the section dedicated to technical indicators on our blog devoted to your trading and crypto education.
Every guide here is free. Browse the full course and join a community of traders who share ideas every day.