In a perfect world, a stock's price always reflects its underlying value. But as you know, financial markets are far from perfect. One of the main sources of this imperfection is human emotion. Powerful trends can decouple price from value and inflate a speculative bubble. The Fear and Greed indicator, or Fear and Greed Index, was created precisely to capture the balance between these two opposing emotions.
Like any indicator, it can't be read or interpreted on its own. That said, it proves to be a useful tool for gauging the psychology of the financial markets — including crypto, thanks to the Crypto Fear and Greed Index. Often cited across social networks and other social media, it deserves to be taken seriously … by testing it against the confluence of other signals and technical indicators!
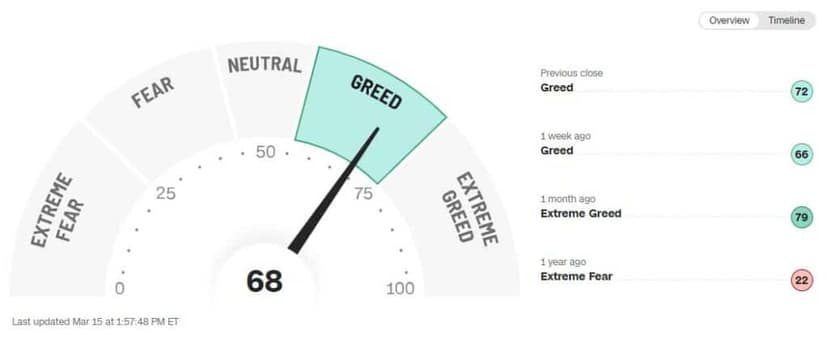
Developed by CNN Business, it's a composite index that aggregates several data sources to determine whether investors are, on the whole, in a state of fear or greed
Fear and Greed Index: Calculation
How does the Fear and Greed Index work?
The Fear and Greed Index is a 100-point scale. A lower reading points to a more fearful, bearish market, while a higher reading points to a more greedy, bullish one.
The index value is a weighted average of seven stock-market indicators, each explained below.
1. Market Momentum
The index measures market momentum by comparing the S&P 500 to its moving average over the past 125 days. Positive momentum — when the current index value is above the 125-day average — tilts the reading toward greed. When the index sits below that average, momentum is negative, signaling that investors are fearful.
2. Stock Price Strength
Also factored in, the stock price strength component compares the number of New York Stock Exchange shares trading at their 52-week highs against those trading at their 52-week lows. More highs than lows signals a higher level of investor greed, while more lows points to a more pessimistic mood.
3. Stock Price Movement
Trading volume can also reflect investor sentiment. The Fear and Greed Index incorporates the McClellan Volume Summation Index, which examines trading-volume trends across high-activity and low-activity days. Rising trading volume points to investor greed, while falling volume signals fear.
4. Put and Call Options
A put option lets you sell a security at a later date, and a call option lets you buy a security later on. The ratio of put options to call options can reveal whether investors mostly expect to sell or to buy going forward.
This component of the Fear and Greed Index tracks the trend of the five-day moving average of the put/call ratio. A value of 1 is neutral. A value above 1 can indicate fear, and a value below 1 implies greed.
5. Market Volatility
The index uses the 50-day moving average of the CBOE Volatility Index (VIX) to measure market volatility. The VIX tracks short-term options activity on the S&P 500. A rising average points to a more fearful environment, while a falling average can reflect investor optimism.
The VIX is meant to be a leading indicator of shifts in market sentiment, though its forecasts are far from perfect.
6. Safe-Haven Demand
When investors get nervous, they often seek safety by increasing their exposure to bonds and reducing their exposure to stocks. The "safe-haven demand" component of the Fear and Greed Index measures this by comparing the returns of Treasury bonds and stocks over the past 20 days. When demand for stocks is higher, investors are feeling greedier. If bonds outperform stocks, investors are more cautious.
7. Demand for "Junk" Bonds
The index measures junk-bond demand through the yield spread between low-quality and high-quality bonds. When the yield spread is narrower, investors are open to more risk and/or are greedier. A wider yield spread points to a more cautious or fearful investment climate.
Fear and Greed Index: Interpretation
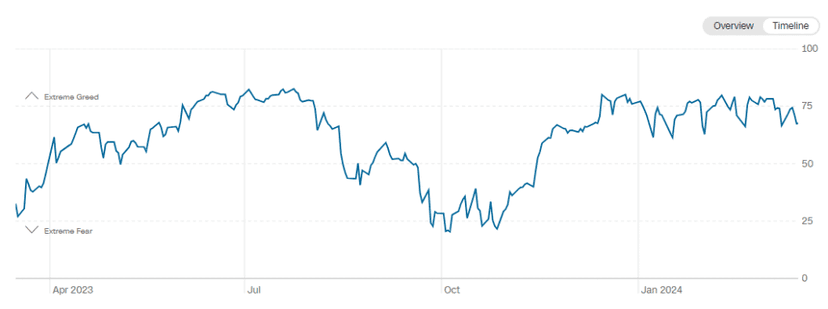
Like many technical indicators, such as the RSI, the Fear & Greed indicator is a gauge graded from 0 to 100. That said, it has never gone beyond 30 and 90 — at least for the traditional financial markets: Forex / currencies, commodities, stocks, indices.
- 0 to 25 | Extreme Fear
- 25 to 50 | Fear
- 50 to 75 | Neutral
- 75 to 95 | Greed
- 95 to 100 | Extreme Greed
Fear and Greed Index: Examples of Use
The Fear & Greed indicator can be used to:
- Identify potential entry and exit points. That said, it can't be the foundation of your analysis! It should stay a "bonus" confirmation.
On that basis, the recommendation is to buy during periods of extreme fear and sell during periods of extreme greed.
- Understand market movements
Fear regularly drives prices down, while greed can drive prices up regardless of how solid the assets under analysis actually are!
- Refine your investment strategy or your trading strategy
Adjusting your asset allocation based on market sentiment can make sense!
Limitations of the Fear and Greed Indicator
- Don't rely on this indicator alone: any indicator read in isolation is meaningless.
It's one tool among many and shouldn't be used as your only source of information.
- The index is subjective:
The perception of fear and greed can vary from one investor to the next.
- The index can be swayed by one-off events:
A major news event can influence market sentiment in the short term.
The Fear & Greed Index turns out to be a handy tool for knowing where you stand on the FOMO or FUD scale!
Used wisely, it can help you make your decisions when you struggle to read the market on your own or you simply don't have the time to do so by other means or through more precise indicators.
Bitcoin, Crypto Fear and Greed Index: What's the Difference?!
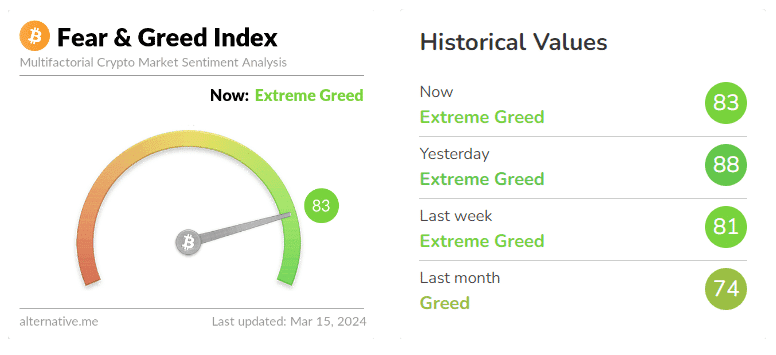
As I'm finishing this article, the Bitcoin Fear and Greed or Crypto Fear and Greed Index is hitting the same highs we saw a few months before the previous ATH — so it's currently in Extreme Greed mode as of March 15, 2024
Just like the indicator dedicated to traditional markets, here it measures the emotional context of investors toward the crypto market, showing whether they're actively investing or tend to be pulling out. That said, the way it's calculated is different!
As you've gathered, it also exists for certain cryptos, including Bitcoin, Ethereum, BNB, Solana, XRP, ADA, DOGE, and so on.
Particularly noticed and cited in the crypto space, this index approaching its top has often marked the ATH on a relatively high timeframe. It's the moment when the buying frenzy of retail traders peaks.
The fair question to ask now is this: are we going to follow a similar pattern?! The answer is probably no, because if you study the criteria used to calculate this indicator in the crypto market, it's quite possible that this cycle will be an unusual one. In fact, at the time of writing, the bull run has already shown glaring differences from the previous ones.
Crypto Fear and Greed Index: Interpretation
The index is divided into five categories: Extreme Fear, Fear, Neutral, Greed, and Extreme Greed, each representing a different level of investor sentiment on a scale from 0 to 100.
Given the history of the crypto Fear and Greed Index, its reading scale is slightly different. Here are the interpretation tiers.
As we also noted earlier, a low Fear and Greed reading implies a fearful investment climate, while a high reading can indicate investor optimism. Labels are applied to the index's ranges, making it easy for you to interpret the prevailing sentiment:
- Extreme Fear | 0-25: Indicates extreme caution and an unwillingness to invest.
- Fear | 26-46: Suggests a cautious approach from investors, presenting potential investment opportunities.
- Neutral | 47-52: Represents balanced sentiment among investors. Price reflects value!
- Greed | 53-75: Shows a degree of confidence in the market.
- Extreme Greed | 76-100: Reaches a high level of bullish sentiment and could signal a market top.
Bitcoin Price: An Example of Interpreting Extreme Greed
When the Bitcoin Fear & Greed Index reaches levels of extreme greed, it can suggest the market is approaching a potential top. Historical data shows a correlation between peaks of market euphoria and the corrections that follow. For example, in November 2021, the index hit a high of 84 just before the price of bitcoin reached $69,000 and ran into resistance.
A similar pattern to the current one was observed in February and March 2021, when extreme greed preceded a market peak. If this trend continues, bitcoin could post fresh short-term gains before a possible pullback — but I've already given you my read.
The previous paragraph was written about ten days before its publication on March 16, 2024 … What's interesting is that we noticed an ATH on our indicator a few days before the new ATH and the pullback!
Spotting Buying Opportunities
Your investing style will determine how you use the index to identify buying opportunities. Value investors and contrarian investors will see buying opportunities when the index value is low.
Short-term traders may see it the other way around. Quick gains are easier to grab when investors are confident and prices are climbing. The scalper may prefer to buy in these greedier climates, as long as they're protected against sharp reversals by their stop-loss orders.
Crypto Fear and Greed Index: Calculation
1. Price Momentum
It analyzes the price performance of the top 10 cryptocurrencies (excluding stablecoins) by market capitalization, including BTC, ETH, XRP, BNB, and DOGE, in order to capture trends across a broader range of assets.
2. Bitcoin and Ethereum Volatility
The index takes into account the Volmex implied volatility indices — BVIV and EVIV — which provide forward-looking measures of the expected 30-day annualized volatility for BTC and ETH.
3. Derivatives Market
The index uses Glassnode's Options Open Interest Put/Call Ratio data on Bitcoin and Ethereum options contracts to gauge investor sentiment over a moderate time horizon. A higher ratio of put options to call options indicates fear, suggesting bearish expectations.
4. Market Composition
The relative overall value of BTC in the market is a key indicator of market sentiment. The Stablecoin Supply Ratio (SSR) is used for this purpose, measuring the ratio between Bitcoin's market capitalization and the total market capitalization of the leading stablecoins.
5. CMC Data Response
The Fear and Greed Index analyzes Google search data via Google Trends and by keyword on social media, along with user engagement metrics, to assess the market's sentiment or emotional context. Retail interest and emerging trends are also taken into account.
This information makes it possible to identify the tokens and projects generating the most interest, as well as the themes that influence the market's emotional state.
Fear and Greed Index vs. Other Indicators
One criticism leveled at the Fear and Greed Index is that it's an average, and therefore less precise than the individual measures. Investors looking for more specific gauges of the "emotional context" may prefer to watch the CBOE Volatility Index (VIX), the put-call ratio, and mutual fund flows.
The VIX is unofficially known as the "fear index". The VIX is a component of the Fear and Greed Index. As a reminder, the VIX relies on options activity to predict short-term volatility on the S&P 500.
The put-call ratio is also a component of the Fear and Greed Index. This measure has a predictive component too, since options traders base their activity on their market outlook. (see: Open Interest )
Mutual fund flows are the net inflows and outflows of money into funds. A net outflow means more investors are pulling money out of mutual funds and exchange-traded funds. In that case, it's an obvious bearish sign.
A net inflow means investors are pouring more money into funds. This usually happens in bull markets and is a sign of investor optimism.
Final Thoughts on the Fear and Greed Index
The role that emotional context plays in stock-market cycles is clearer in hindsight.
For example, today we can look back at the dot-com bubble with complete clarity and draw a conclusion. Too many investors greedily piled into tech stocks without caring about company fundamentals. But amid the tech euphoria, this influence of emotions was far harder to spot.
What's more, today we understand why that enthusiasm was justified on the one hand, and why it wasn't on the other.
If you're not a specialist, this index lets you read investor sentiment simply and interpret it quickly. If you agree with the logic that investor sentiment pushes stock prices up or down, you can use the Fear and Greed Index as a general valuation gauge.
Identifying Your Own Emotions
Suppose you feel compelled to sell everything at a moment when the Fear and Greed Index is holding below 25. The index's low level should prompt you to think more deeply about your motives. Have your holdings permanently deteriorated to the point where you have to sell now? Or are you letting yourself get swept into panic by a prevailing climate of fear?
The reverse situation can be just as instructive. If you're aggressively buying stocks at a moment when the index value is very high, that's a sign to pause. Reflect on your core investment approach and assess whether you're still following it with discipline. Careful — as I'm releasing this article, remember that we're right in the thick of it!
You should avoid loosening your investment / risk-management parameters just because the market is buzzing. That approach can backfire on you later. On top of that, when the crowd behaves this way, it creates even more volatility once the market turns.
In short, when you're short on time, the Fear and Greed indicator is genuinely handy because it clears the landscape for you. That said, if you want real analysis tied to emotional context, you can absolutely push in that direction and build a trading system and strategy using more precise indicators! To wrap up: it's not superficial — far from it! That said, for a dedicated trader, it doesn't hold much value.
Every guide here is free. Browse the full course and join a community of traders who share ideas every day.