Mastering moving averages and the exponential moving average is a serious asset when it comes to running a technical analysis of the financial markets you want to speculate on. Here is a theory-focused trading course that will get you started with this already very widespread indicator!
The Different Types of Moving Average
Moving averages are technical indicators used in technical analysis, widely used in trading to identify the direction of an asset’s trend. They smooth an asset’s prices over a given period to provide an overall view of the trend. There are several types of moving averages, each with its own specific characteristics and applications.
To begin, here is a comprehensive overview of the different types of moving averages that can be used in trading.
1. Simple Moving Average (SMA)
The Simple Moving Average (SMA) is the most basic type of moving average. It is calculated by adding up an asset’s closing prices over a given period, then dividing that sum by the number of periods. The SMA provides a smooth average of prices and can help identify the direction of the long-term trend. However, it can be relatively slow to react to recent price changes.
Formula for calculating a simple moving average:
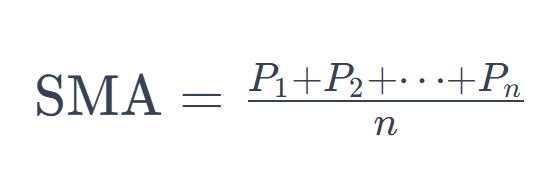
P1, P2,…,Pn are the closing prices for the n periods.
n is the total number of periods.
2. Exponential Moving Average (EMA)
The Exponential Moving Average (EMA) gives more weight to the most recent prices through an exponential weighting system. This means it reacts more quickly to price changes than the SMA. The EMA is especially useful for trading strategies that require quickly spotting trend changes.

V is the day’s closing price.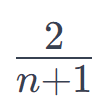
α is the smoothing constant, calculated as for an average over n periods.
EMAprevious is the EMA value for the previous period.
3. Linear Weighted Moving Average (LWMA)
The Linear Weighted Moving Average (LWMA) also gives more weight to the most recent data, but the weighting increases linearly for the most recent data. It therefore reacts more quickly to price changes than the SMA, but less quickly than the EMA. The LWMA is often used to confirm trends in fast-moving markets.

4. Smoothed Moving Average (SMMA)
The Smoothed Moving Average (SMMA) is similar to the SMA, but it smooths price fluctuations further by redistributing the last price across the whole period. It is less common than the SMA and EMA, but can be useful for filtering out market noise in more stable trading environments.
5. Adaptive Moving Average (AMA)
The Adaptive Moving Average (AMA) adjusts its sensitivity based on market volatility. It becomes more sensitive during periods of high volatility and less sensitive during calm periods. This allows the AMA to adapt to changing market conditions, offering an edge in detecting trends in highly volatile markets.
6. Hull Moving Average (HMA)
The Hull Moving Average (HMA) uses weighted moving averages to improve responsiveness. It combines several moving averages of different periods to create a smoother, faster average. The HMA is designed to reduce lag and increase the accuracy of trend detection.
7. Variable Moving Average (VMA)
The Variable Moving Average (VMA) adjusts its length based on market fluctuations. Its period varies with volatility, which allows better adaptation to specific market conditions. The VMA can be very useful in highly volatile markets.
8. Double Exponential Moving Average (DEMA)
The DEMA uses two exponential moving averages to reduce lag. It is calculated by subtracting a longer-period EMA from a shorter-period EMA, which produces an average that is more responsive to price changes.
9. Triple Exponential Moving Average (TEMA)
The TEMA extends the DEMA concept by adding a third exponential moving average. This reduces lag even further and improves responsiveness to price movements, making the TEMA useful for short-term trading strategies.
Each type of moving average has its advantages and disadvantages, and the choice depends on your trading strategy, your investment style, and the specific market conditions. Experienced traders often combine several types of moving averages to build more robust and flexible trading systems.
Personally, I just combine the first two types with a few of my other favorite indicators. That is enough within my system, but feel free to test others that might suit you better!
How to Use Moving Averages?!
Originally, moving averages are used to identify crossovers, or “crosses.”
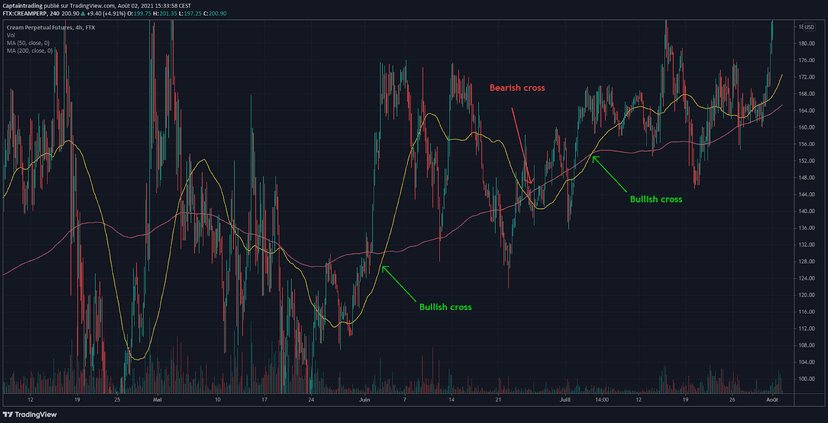
A moving average crossover is defined by the intersection of 2 moving averages, and it can signal a trend change. When a short MA 50, for example, crosses above a 200-day MA, this is what we call a “Bullish cross.”
When the shorter-period moving average crosses below a larger one, this is a “bearish cross” and a sell signal.
Note: crossovers are fairly “useful,” but they are not optimal either, because we often spot them too late.
There are far more effective methods, and that is exactly what we will focus on next with Support & Resistance and defining a clear trend.
- When price is below or above a given MA or EMA.
- When an MA or EMA is rising or falling.
We will also look at how to anticipate volatility and prepare for a big move using the compression phase.
Support and Resistance
Using MAs AND EMAs to define effective S and R is fairly precise; it is actually one of my favorite uses of Moving Averages.
In fact, you can use Moving Averages the same way you use our horizontal and diagonal lines on price: as supports and resistances.
Personally, I tend to focus on the MA100, EMA200, MA 300, and EMA 13 for my supports and resistances.
The EMA 34 and EMA55 are also useful when it comes to confirming my levels when I am scalping and trading intraday.
Overall, these are the most effective, but some people like to adapt them to their own personal use.
Do note, though, that the EMA 200 on the 4H is extremely effective!
In a Bullish market with a clear trend, it is important to focus on the coins that are above these so-called key Moving Averages.
In that case, the recommended play is to buy the re-tests or pullbacks.
This is a strategy that works well, so I encourage you to run your own backtests. If the market turns bearish or moves into a range, buying the pullback becomes a bad strategy.
It is entirely possible to dig deeper into this, but let’s now move on to the “angles” and “slope,” which are more meaningful.
The point is to optimize your timing so you can seize opportunities while optimizing your entry points. The goal is simple: spot the compression phases using Moving Averages.
The last link after a moving-average signal is execution. Our Trade Assistant guide shows how, on MT4/MT5, the size of each entry is derived from the stop rather than picked at random.
The key takeaway on this first point is that the supports and resistances derived from the Moving Average and Exponential Moving Average are always more solid on higher timeframes than on smaller ones.
It’s the same as with Price Action … Here there’s no catch!
The “Slope” on Moving Averages and Exponential Moving Averages
We have just seen that Moving Averages can be used to define supports and resistances.
However, keep in mind that not all supports and resistances should be analyzed the same way. Learn to rank them!
A descending Moving Average always makes a more solid support than when it defines a resistance: it is more likely to act as a resistance rather than as a support.
Conversely, a rising Moving Average always makes a more solid support than when it defines a resistance: it is more likely to act as a support rather than as a resistance.
How to Trade with Moving Averages?!
When the market structure is bearish/descending and price hits the Moving Averages and Exponential Moving Averages, you can normally treat it as a resistance. It can therefore be used as a signal to short ( = to be a seller ).
Conversely, when the trend is bullish/ascending and price hits the MAs, you can generally treat it as a support. It is therefore a signal for long ( buy-side ) entries
When the trend is not clear, it means we are in a consolidation or accumulation phase. From then on, unless you are trading the fundamentals and ready to hold over the medium or long term, it is simply better to stay in observation mode until a clear trend emerges.
There is one message people keep drilling into beginners: “buy the dip,” and even in a downtrend at that. What a danger, and above all what a risk…
Buying the Dips is a good method when the trend is bullish. In a downtrend, it’s the opposite!
Entering a long while the uptrend is not confirmed has more to do with FOMO and wishful promises than with credible, coherent evidence. After that, it’s up to you, but I strongly advise against it unless you are literally an “insider,” which I very much doubt… unless you are an “insider”.
Even when you are flirting with a bottom, it makes no sense, because entering a position will cost you fees — that much is certain, unlike … the trend.
In a rising market, we have a unique chance to succeed at almost everything and grow quickly. Above all, remember that investing in positions that show no favorable sign relative to your strategy is just as damaging as a trade with no Stop Loss.
In the next section, we will see how to spot compression phases using Moving Averages and thereby identify the coins that are “ ready to spring into action ” …
Here is an example with CREAM

Compression VS Extension
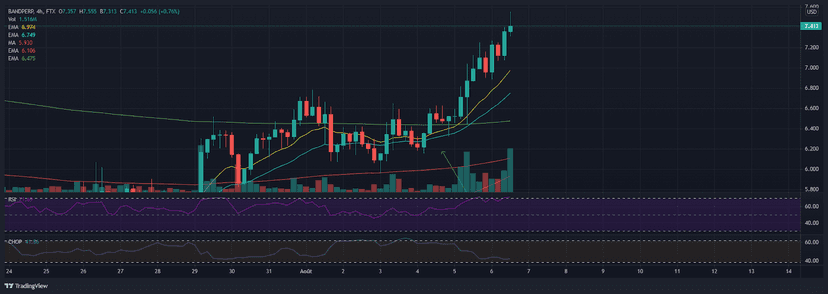
Following a compression, we notice an extension, or expansion. Because of the volatility that follows the compression, the MAs and EMAs diverge, so we observe a spread between the MAs and EMAs.
The next step is to watch which one — the Moving Average or the Exponential Moving Average — takes over as support in an uptrend. This could be useful for adding a few scalping entries, for example.
This is where the so-called secondary EMAs, such as EMA34 and EMA55, come into play.
Compression on a Moving Average – Definition and Purpose
Supports and resistances are one thing. But what happens when you are on a Moving Average support and you notice a strong resistance just above?
What happens if several moving averages form possible supports on a retracement? Which one is the most solid, and so what will be my invalidation point?
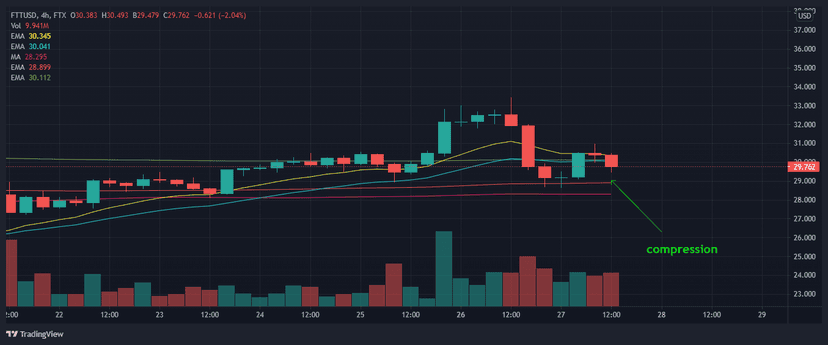
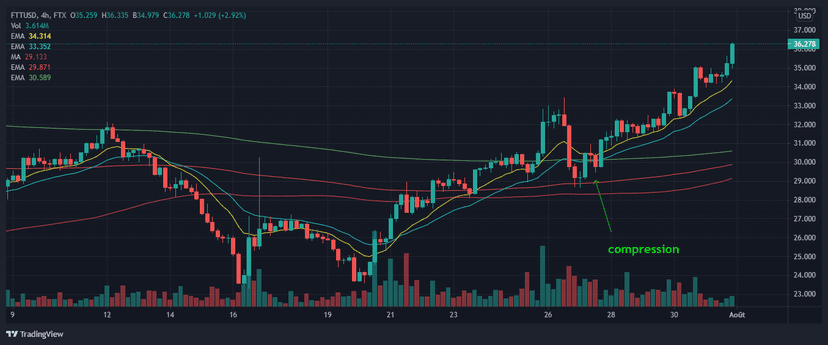
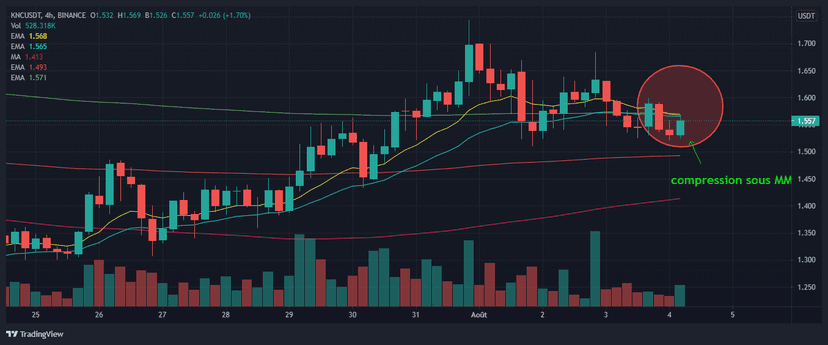
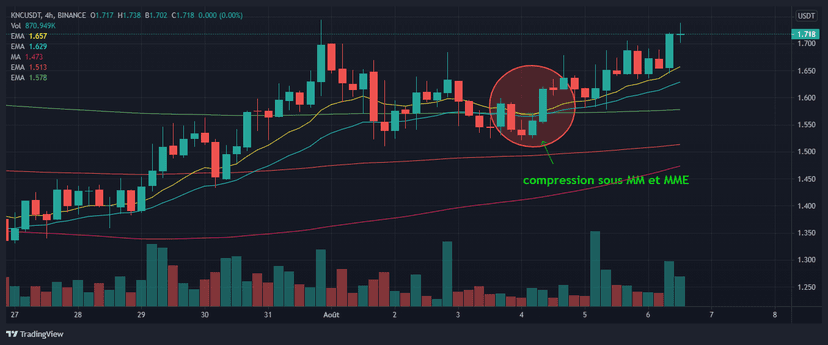
A compression on a Moving Average is defined, on a specific timeframe, by so-called key Moving Averages compressing into a particularly narrow band.
Let’s study 2 different types of compression: the compression that leads to a possible trend reversal, and the one that leads to a trend continuation.
It is, in a way, an improved version of the Bollinger Bands, one that lets you anticipate volatility.
The idea is this: seeing moving averages compress below price is easy to understand, because they act as a classic support.
On the other hand, it is common to see moving averages pointing downward, acting as a resistance just above price.
You might think this is a bearish signal, but it very often means an accumulation phase is required before moving on to a trend reversal, or to a re-accumulation in the case of a trend continuation.
Indeed, a coin that has just made a new lower low, or that retraces instantly after a rally, has very little chance of forming a V bottom for us.
Hence the need to watch for compression phases!
The main benefit of spotting compressions is finding high-probability entry points while avoiding the risk of getting in too early. Honestly, I have sometimes noticed compressions just by opening coinmarketcap. Sometimes it is so obvious that this signal is truly important to master.
MA compressions are simply a different way of approaching Price Action consolidations. In many cases, it turns out to be a powerful tool compared with the classic triangles, channels, or the simple defining of trends through price action.
Just like supports and resistances, you will notice compressions on certain Timeframes that will not necessarily be visible on a higher timeframe — hence the importance of trading your signal only on the timeframe you have chosen, or else you will need to look for confluence on higher timeframes.
Examples of compression highlighted using Moving Averages:
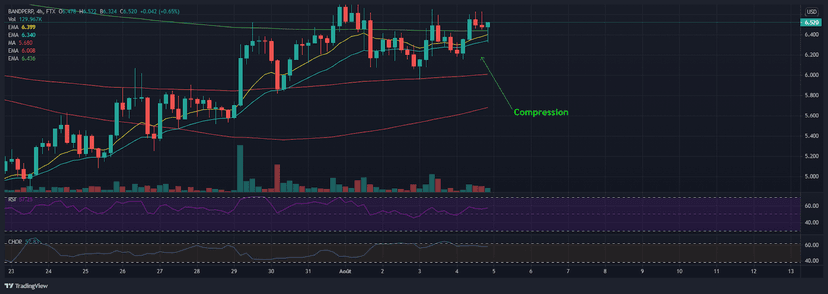
You will find all the examples shown above in this drive folder:
The Order of MAs and Exponential Moving Averages
The examples shown earlier focus on compressions and trend continuation. In that case, you read from the bottom to the top! We had the MA 300, the EMA 200, MA 200, and MA 100 for the Moving Averages on the macro view
If we look at compressions preceding a trend reversal, the order is the opposite ( starting from the bottom to the top: MA100, MA200, EMA200, MA300 )
The order is crucial, because the trend cannot be considered truly reversed unless the MA/EMAs are in the right order.
Usually, for long-term observations, I favor the EMA200 over the MA200, even though both work.
The fact is that the EMA 200 will always sit between the MA100 and the MA300. This guarantees the “cup” shape that lets us work easily with clear signals. That will not be the case with the MA200. I encourage you to check for yourself in backtesting to understand )
If you use the MA200, you need to pay particular attention to it, because unlike the EMA200, it is not guaranteed to sit between the MA100 and the MA300.
This also applies to the short-term exponential moving averages (EMA13 and 21 or 25, 34 and 55).
A short-term trend is considered to be in consolidation until the MA25, 34, and 55 are aligned in the right order. We will dig deeper into this a little later in the MA & Chop chapter.
First, I encourage you to look at the simpler, most conventional case, namely the Daily chart showing an accumulation and a quick reversal..
The Reversal on the Daily:
- All the MA/EMAs are descending = no Long.
- A support is found. The usual Price Action tells you to buy, but the cost of that opportunity is often quite high. On top of that, you are not safe from new lows as long as the trend actually remains bearish.
- The MA/EMAs flatten and tighten.
- All the MAs are aligned in the right order.
- On the Daily, the MA100, MA200, EMA200, and MA300 must take up this order.
Exponential Moving Averages: the Order Required to Short
The principle is fairly similar to what we have just observed for the MAs in the context of Longs.
The EMAs used are 13 and 21 or 25, 34 and 55, with the 89 as an option. This is the order required for a Bullish ( Long ) signal. The order must be the opposite for a Bearish ( Short ) signal.
Focus on the Timeframes from H4 and lower.
You will normally notice a strong confluence of all the MA compressions. Pay attention to the EMA signals whose directional bias is the same as your MA compressions on the Long side. This will help you fine-tune the timing!
If you are familiar with the “Guppy” indicator, know that it works the same way. The only difference is that the Guppy can “flip” even when the EMAs are in the right order, which can give us bad signals.
The Fractal Nature of MA/EMAs
Let’s take the EMA200 on H4, H1, M15, and M5 on a coin as an example.
On most Altcoin Perp Swaps, you will observe that the EMA200 acts as support and resistance on every timeframe.
Patterns such as compressions can be observed on a single timeframe. The higher the timeframe on which you spot the pattern, the larger the expected move will be.
It’s exactly like when you work with triangle patterns or horizontal supports.
Just as with other strategies, the levels defined by higher timeframes will be more solid than those on smaller timeframes.
This is the foundation of the system dedicated to multi-timeframe scalping in part 4 of this guide. It is a faithful description in case you want to start backtesting before diving into part 4 of the guide.
The daily charts describe the bullish or bearish bias as well as the Intraday volatility.
The H4 charts give us a “Choppiness”-type reading. Indeed, we have seen that a compression on H4 generates large moves.
The opposite is also true: a lack of compression will indicate that we are more likely to see price “range,” which is perfect for scalping!
As for entry points, I encourage you to refocus on the H1 timeframe, on which you can then fine-tune the timing with M15 compressions.
The ideal setup is a Long support on the daily (ema13) while price ranges between the MA300 and MA100 on H4.
Use the MA100/EMA 200 on H1 and, above all, pay attention to the slope and the angles of the MAs.
By stacking up signals in favor of the anticipated scenario, your win rate rises considerably! As a reminder, every signal or hunch must absolutely be confirmed by indicators of a different nature from the one that first tipped us off. Sometimes everything is clear from a single observation, but that remains very rare!
An additional confluence signal would be to see an order of the EMAs that matches a Short signal.
The order is truly essential in this case!
Analyzing MAs and EMAs in “Lazy” Mode
Careful — this mode does not suggest you should forget the full system. That said, it may let you save time and therefore lower your cost per entry.
The idea is to place the MA100, EMA200, and MA300 on an H1 chart and on an H4 chart in order to check the potential confluence between the compressions of the 2 charts, so as to get Swing entry points.
Apply the usual formula on your H4 chart: MA100, EMA200, and MA300.
Add the MA25 ( which corresponds to the MA100 on H1 ), the EMA100, and the so-called short EMAs (13, 21, 34, 55).
Turn off the wicks, or leave them out during your analysis.
Finally, you can go Long on the “Super Confluences.” A super confluence is a bit like a Bullish Cross. The difference is that we get a cluster of ultra-tight points from all the MAs and EMAs described above.
Ideally, the EMA200 on H4 is flat and all the Short EMAs on H4 cross it from below.
After everything I have read and observed about EMAs and MAs, this is by far the best use I have tested and enjoyed. It is not the pillar of my strategy, but it is an approach I like, especially when I am looking for signal confluence or when some doubt remains.
I am also opening up this topic to help you broaden your horizons across different strategies. The goal, then, is to vary your approaches so you can optimize your strategies and your gathering of signals.
Let me remind you that studying a strategy is not the same as taking one trade and seeing whether it works…
You need to test a strategy over a substantial sample of trades, otherwise it is pointless.
Happy trading, everyone,
NB: there is no magic formula, other than: rigor, regularity, consistency, and self-reflection.
Every guide here is free. Browse the full course and join a community of traders who share ideas every day.