Bollinger Bands: Definition
Bollinger Bands are a common technical indicator plotted directly on the chart. Traders use them to analyze market volatility. They also help pinpoint overbought and oversold levels. John Bollinger invented them in the 1980s. They are still widely used today.
In this guide, we'll look at the different ways Bollinger Bands can be used in trading. We'll also cover the advantages and drawbacks of using them.
How to Interpret Bollinger Bands
Bollinger Bands are made up of a central band, which is actually a moving average. Two additional bands sit around it: an upper band and a lower band. These two bands are set a certain number of price standard deviations away from the moving average, which is how they account for volatility.
By comparing the price against the Bollinger Bands, a trader can gauge whether an asset is worth trading. On top of that, the width of the bands gives you a read on its volatility.
Narrower bands point to lower volatility, while wider bands suggest higher volatility.
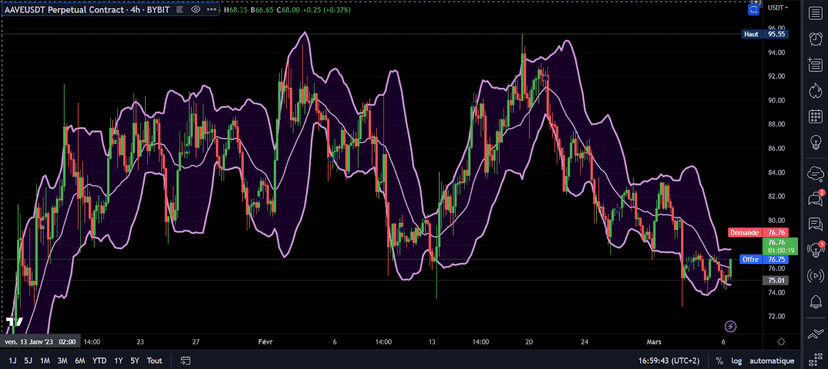
Using Bollinger Bands typically calls for a 20-period moving average. The timeframe used can be 5 minutes, one hour or one day.
The upper and lower bands are usually set two standard deviations away from the average. That said, you can adjust both the number of periods in the moving average and the number of standard deviations.
How to Use Bollinger Bands
Before diving into how to use Bollinger Bands, it's essential to remember that when the price touches the upper band, it doesn't necessarily mean you should sell. Likewise, when the price touches the lower band, it doesn't mean you should buy. John Bollinger himself stated: “A tag of a band is not in and of itself a signal.”
In a strong bull or bear market, prices can touch or push past the extremes repeatedly. That's why it's often wise to wait and look for meaningful patterns before acting — among them the “double bottom”, the “classic M top” or the “three pushes to high”. Now, let's examine these patterns through the lens of Bollinger Bands.
Bollinger Bands and Trading Patterns
The Double Bottom Pattern
The double bottom trading pattern is characterized by a drop in value. This is followed by a period of appreciation. Finally, you see a second decline in price near the initial low, before a second rise.
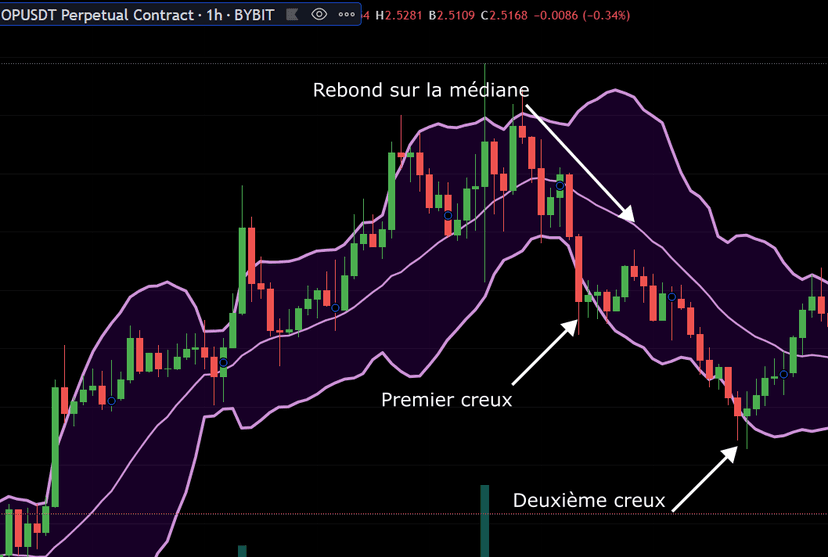
To spot and anticipate a “double bottom”, look for a price that has reached the lower band and watch the next trough. If the price bounces back up to the middle band, then falls again to the lower band, it can signal that the price is ready to move higher. That makes it a good moment for a trader to buy.
Bollinger Bands provide context when you're studying how an asset is performing.
If you notice a second trough on the chart of the asset you're watching, and it sits lower than the first, then without the Bollinger Bands it might look like the trend is reversing.
By watching the Bollinger Bands, though, you pick up on the sign that our asset is getting ready to follow the initial trend despite volatility “that has the price drooling” …
The Double Top Pattern
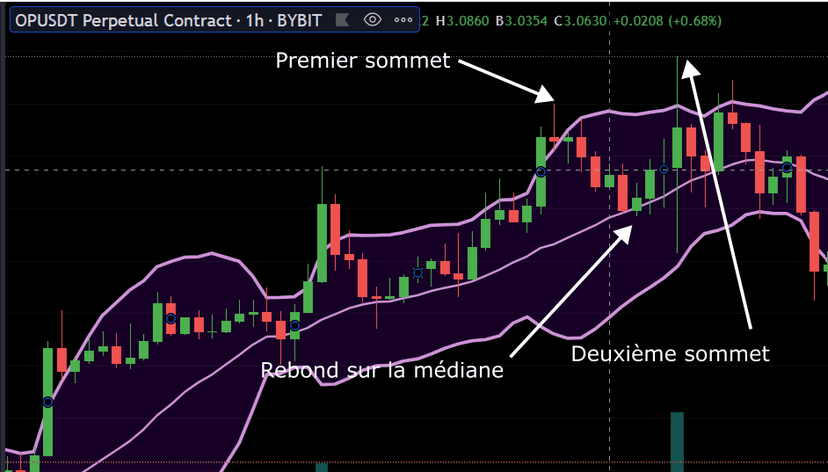
The double top trading pattern forms when a push to a peak, followed by a sell-off and a test of the previous peak, produces a classic double top. The second peak may be higher or lower than the first. As a trader, you might wonder whether the asset is in a fresh uptrend or has hit a resistance level. Bollinger Bands can be used to find the answer through a confluence between the signals given by Price Action and the Bollinger Bands.
When a Double Top forms, the initial peak may reach or exceed the upper band, which drives the price down toward the middle band (which is the moving average).
The second peak can be higher or lower than the first, but it must sit within the upper band, which implies it is a lower peak relative to the previous one. That can be a sign it's time to sell.
The Three Pushes to High Pattern
A “three pushes to high” top is often the precursor to a larger, more extended topping formation. It tends to take shape as follows: first, a peak is made beyond the upper band; then a peak is made that reaches the upper band; and finally, a peak is made inside the upper band.
This can be a good sign that momentum is starting to slow. You may also notice that volume is declining.
The trading pattern “three pushes to high” is complete when the first peak is above the upper band, the second peak is on the band and the third is below it.
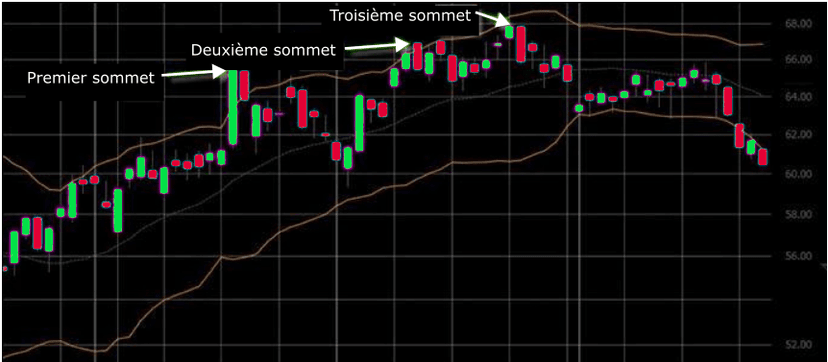
Once the first peak is above the upper band, the second does the same and the third sits below the upper band, the three pushes to high pattern is complete.
Frame the Move with Bollinger Bands
Bollinger Bands can tell us when a powerful trend is ending — especially the ones that emerge after price breaks out of a range.
This triggers a burst of volatility that shows up as the bands spreading apart from one another. During a vigorous uptrend, the lower band will actually move downward, that is, opposite to the trend. When the lower band starts to rise, it can be a signal that the advance may be over, at least temporarily.
One interesting application of Bollinger Bands is the insight that volatility tends to revert to its mean. As a rule, periods of low volatility are followed by periods of high volatility: expansion, compression and vice versa.
A squeeze can be seen when the bands become particularly narrow; this means volatility is low.
It's important to remember that volatility tends to revert to its mean. From there, the bands are expected to widen quickly in this context, signaling the potential for a powerful move. To spot a squeeze, you can look for the moment when the bands were at their tightest over the past six months.
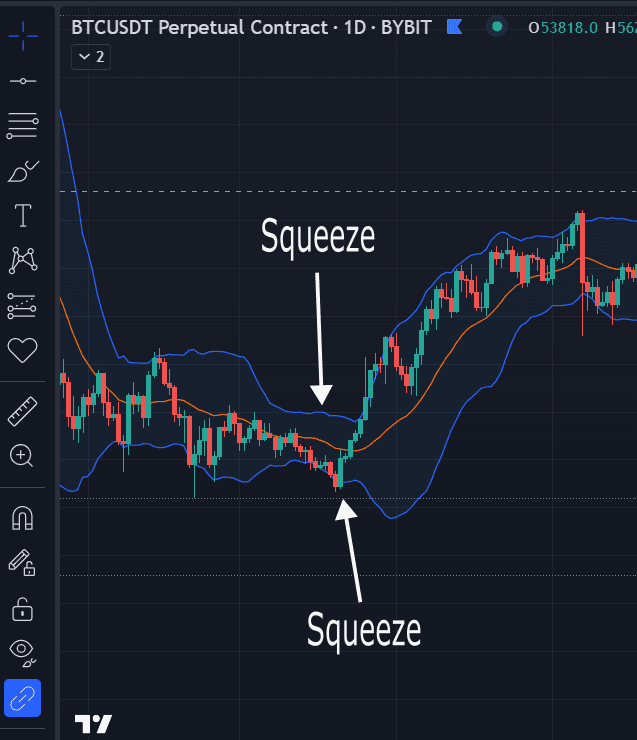
As the Squeeze example above shows, the Bollinger Bands display a degree of tightening. This compression points to a high probability that volatility will increase, as it did here.
If you're looking to hold a position for a long time while trading a squeeze, you can consider placing a buy order above the upper band. Then you place an initial stop below the low of the breakout, or below the lower band.
Alternatively, if you're a seller, you can enter the compression zone with a short sale at a point below the lower band. Once the sale is executed, remember to place your initial stop above the high of the breakout, or above the upper band.
Don't forget to adjust your stop orders as needed, or try using a trailing stop set as a fixed amount or a fixed percentage.
Those stop adjustments — the trailing stop especially — are handled well by Trade Assistant on MT4/MT5: the add-on works out the position size before the order, then trails the position after entry.
Finally, if you want to capture longer moves, you can exit when the asset touches the opposite band (for example, the lower band if you're long, or the upper band if you're short).
Bollinger Bands vs. Technical Indicators
If you want to strengthen a technical analysis, you can add volume indicators to Bollinger Bands, which are only a price indicator. No indicator can guarantee that you'll enter or exit a trade at the best possible moment, but combining Bollinger Bands with the confluence of other techniques such as Price Action can be beneficial when making decisions.
In short: Bollinger Bands are a technical analysis tool commonly used by traders to help identify market trends and price volatility levels. Here are some of the best ways to use Bollinger Bands in trading:
1. Identify support and resistance levels: Bollinger Bands can help identify price support and resistance levels by monitoring how price moves around the bands. Prices that bounce off the lower band can indicate a support level, while prices that bounce off the upper band can indicate a resistance level.
2. Identify overbought or oversold conditions : Bollinger Bands can also help identify overbought and oversold conditions in the market. Prices moving away from the upper band can indicate that the market is overbought, while prices moving away from the lower band can indicate that the market is oversold.
3. Identify trend reversals : Bollinger Bands can also help identify shifts in the market's trend. A sharp increase in volatility, as shown by an expansion of the bands, can point to an imminent trend change.
4. Use alongside other indicators: Bollinger Bands can be used in conjunction with other indicators to confirm trading signals. For example, a crossover of the moving average with the upper band can signal a buy, confirmed by an overbought reading on the RSI.
Conclusion
Remember that Bollinger Bands are just one technical analysis tool and don't guarantee 100% positive trading results. You should always use your own judgment and your own analysis to make your trading decisions.
To round out your trading education, feel free to check out all the online training I make available to you for free. You can also join my community on Discord through the free public Discord.
Also take a look at the free Captain Trading space: with a simple account, you get the daily plan in your trading journal, decoded COT reports, lives and their replays, and the community help room built right into your dashboard — you ask your question in your language and we answer in your language! It’s all free. If you’d like to support us, open an account with one of our partner platforms through the Cashback page: 5% of your trading fees are yours for good, and 10 to 20% in the months when your volume justifies it — that’s what allows us to keep going.
Every guide here is free. Browse the full course and join a community of traders who share ideas every day.