Introduction to Price Action Trading
In my view, analyzing and interpreting Price Action is essential to becoming a profitable trader.
This trading course is a must for every single member of the community who wants to learn my method.
Even if you cross-check your analyses, Price Action analysis must become one of the foundations of your system! Once you’ve finished this complete Price Action course, I strongly recommend tackling my ultimate guide to learning to trade !
More often than not, Price Action analysis anticipates the news. That regularly lets you stay up to date even when you’re missing a piece of information that is nonetheless crucial.
Finally, if you’re interested in my method, you have to understand that the foundations of my technical analysis are built on Price Action. Only then do I aggregate indicators or confluent signals such as trading patterns or technical indicators, and define my trading strategy!
In my opinion, learning “Price Action Trading” isn’t optional, so I wish you happy learning!
What Is Price Action Trading? A Definition
Defining Price Action is fairly simple in literal terms: it’s the history of price movement. Price Action Trading is the entire trading strategy founded on the analysis and interpretation of price movement.
In reality, Price Action is the foundation of all technical analysis. Many short-term traders rely exclusively on PA and the patterns that stem from it to make their decisions. Personally, I add very few elements to my Price Action technical analysis to find clear signals!
Why Price Action?
Everything that affects a market — from the news to economic reports, by way of the big institutional players like hedge funds and banks — is reflected in the raw price action on a chart.
The moment you try to analyze variables external to a market’s price, you’re doing something counterproductive: you waste a considerable amount of time because you overcomplicate your analysis with nothing conclusive to show for it.
Price Action Strategy: Why Prefer the Noise to Logic?
Price analysis takes into account all the market’s data and gives a clear picture of what’s happening in it. If you try to analyze every fundamental variable that can influence a market each day, you’ll go crazy.
So a question arises: would you rather cross a dangerous road at night or in broad daylight?!
Would you rather have a serious conversation in the din of a shopping mall or in a perfectly quiet meeting room?!
A considerable amount of “noise” pours out of the (financial) media about what a market “might” do next if the war ends, for example.
At one point, people were also speculating about restarting nuclear power plants in France and across Europe, and so on.
A special shout-out to our dear “experts”…
All that matters is what the charts show us!
Let’s take a simple, striking example from 2022 with the Euro. On the chart above, you’ll notice how the EUR/USD market has been in a clear downtrend for a year.
The chart shows that prices will probably keep falling because there’s a clear trend — unless we spot a reversal pattern…
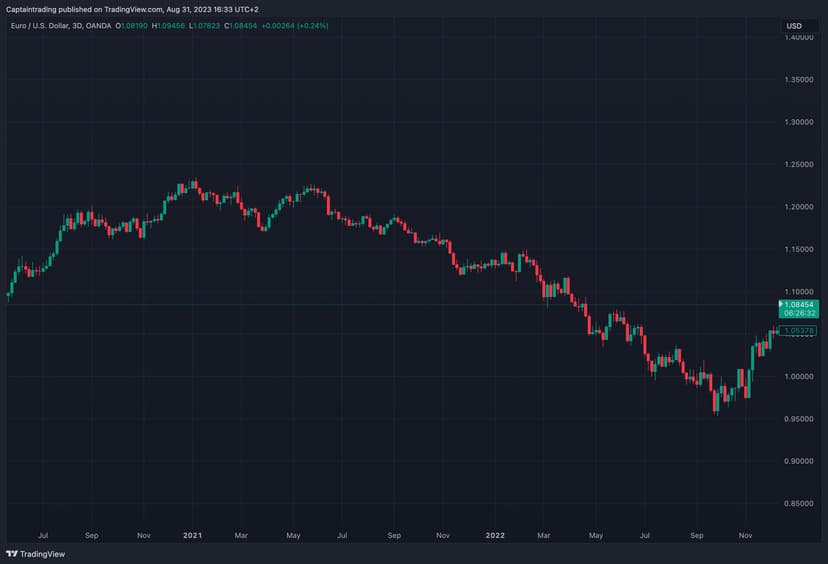
From this information, we could have looked for price action reversal strategies off the resistance. We could also have looked for a bearish pattern to trade the trend.
Meanwhile, there were bound to be countless events, such as the ECB raising its policy rate, along with a multitude of economic reports published over the preceding months suggesting the price might rise, while others said it might keep falling.
To cut through all that noise made up of contradictory data, all you had to do was look at the raw price data on your charts.
So here’s a first part of the answer as to why I’ve long favored Price Action analysis to drive my trading plans.
Technical Analysis or Fundamental Analysis?
The old debate between fundamental analysis and technical analysis is probably endless. So-called “fundamental” traders use the news and economic data to make their decisions. They’re convinced this information helps them make the best choices.
Whereas traders who use technical price analysis make their trading decisions solely on the basis of charts and level 1 indicators.
Those who analyze price are a specific type of trader because they make all their trading decisions solely on the basis of price movement. Other traders who favor technical analysis may use indicators or trading software, and so on. But for Price Action traders, the foundation is Price and price alone!
The main reason I trade with — and strongly recommend — Price Action trading is simply that all the fundamental variables affecting a market, whatever the type of event (war, weather, politics, etc.) through to economic reports, are all ultimately reflected in price movement (price action) on a raw or “naked” price chart.
In my opinion, and in the opinion of many other profitable traders, analyzing fundamental data is a distraction. More often than not, it’s a waste of time for the trader. That said, be careful not to confuse trading with investing.
It’s very often a waste of time, because you can get all the information you need on a market simply by analyzing price action, since price action reflects the fundamental data anyway.
Think of Price Action trading as getting the purest form of market data, filtered and cleaned: ready to use!
As traders, we’re simply trying to profit from price movements in the market. So it makes sense to analyze the actual price action rather than the variables that might eventually lead to a price move…
So, convinced by Price Action analysis for defining your trading strategies and plans?
If so, enjoy the read and the watch, because here’s my complete introductory tutorial to Price Action!
Price Action & Fibonacci
If you’ve already fully mastered Price Action, I encourage you to look into Fibonacci retracements as soon as possible.
Indeed, the confluence of my support and resistance levels with the significant Fibonacci levels regularly lets me define buy and sell signals to watch!
Fibonacci is a must-have in my method!


Price Action: Momentum and Divergence
Here’s one of my latest free courses on Price Action. It’s also available to you on YouTube.
If you’ve already fully mastered Price Action and Fibo, then you can go ahead and check out this course.
My First Price Action Tips
Here are a few tips to understand the psychology and the paradigm that frame Price Action.
1. A first general tip for getting better as a PA trader. First of all, I urge you to set aside your own opinions, predictions and emotions in favor of price movement almost exclusively. Uptrends, downtrends and ranges become clearer once all personal bias is stripped away.
2. My second tip for becoming a better trader is to build trading plans showing good risk/reward ratios ( R:R = Risk to Reward ) at entry. Careful: it must be calculated from the stop-loss relative to the potential reward of the profit target.
3. Run tests! Use backtesting, historical chart studies and paper trading to analyze the quality of your entry and exit signals so you can optimize your profitability.
4. Put risk management in place and handle position sizes you can take on without any trouble; ones you can manage without emotions, ego or stress interfering with the execution of your trading plan. Find THE position size that lets YOU manage both risk and emotions.
5. Create a watchlist of the coins and securities that best suit your method and trading style. Also pay attention to your tolerance for volatility! If you’re a day trader, you need significant intraday moves. A swing trader will appreciate ranges. A trend follower, meanwhile, needs clear long-term trends to be profitable. Nothing stops you from mixing it up — quite the opposite…
6. Never put all your eggs in one basket and build a diversified watchlist to give yourself more chances of finding the signals you’re after and the patterns that suit you best! Don’t hesitate to watch stocks, commodities, currencies, derivatives, different sectors, and so on. Each market can move differently and you need to be ready; it would be a shame to miss opportunities that fit you simply because you’re a little too fixated on crypto!
7. Same goes for patterns and strategies: diversified trading plans will give you interesting opportunities no matter the market conditions!
It’s entirely possible to mix patterns to buy pullbacks, lows, breakouts, trends and ranges.
8. Factor in volatility when choosing your position size. If a security’s price becomes twice as volatile, you can absolutely halve your position size to reduce your risk of loss. Tightening your stop-loss is a bad idea, since in a volatile context logic would tell us to do the opposite in order to boost the chances of a position working out.
9. Identify the type of market you’re trading and define your bias clearly. A security’s price moves from an uptrend to a downtrend and settles into ranges. There’s no fourth path…
Trading volume is volatile too; it can spike or drop suddenly. In short, the variables are what they are! Knowing which type of price variation is occurring will considerably increase your chances of success when trading trends and ranges.
10. Define a precise plan! Anticipating and quantifying every trade is essential!
Know where you’re entering, what your position size will be and when you’ll exit, whether the trade wins or loses. This must always be done before you commit to a trade, even if it’s just two lines scribbled on a corner of your desk. Don’t forget: you always make better decisions before you’re mentally and emotionally committed to a trading position.
These first 10 tips were aimed above all at beginner traders, but I’m convinced that many experienced traders found a few reflexes worth keeping in them too!
Now let’s move on to my 7 tips for those who already have a few trades under their belt!
Enough chit-chat, here are the basic rules of Price Action!
- Traders who rely on Price Action follow one very simple first rule: if a trade opportunity can’t be spotted easily, then it doesn’t exist!
There are no riddles to solve or conflicts to dodge; nothing should be “cumbersome”. The opportunity must be easy to see, even obvious.
- A poor understanding of how the market works will cost you steep tuition fees… in the form of losses.
Hear it, understand the market as if it were an auction or a living being. If you like metaphors, these can help you.
- You can’t take a position without preparation, standing idly by like a spectator watching the trains roll past…
In fact, impulsive trades are almost always losing trades.
Executing a trade takes a few seconds. Preparing it, on the other hand, must be done meticulously, while patience must be your best ally.
- If theory and concepts hold no more secrets for you, that’s perfect!
But that won’t make you a trader…
Consider your first 1,000 trades an integral part of the curriculum for learning to trade!
- Following signals is a conventional, ultra-effective way to blow up!
It’s a shortcut, and when money is involved, there’s no shortcut without significant risk!
It’s important to feed off the experience of seasoned traders — I’m certainly not going to tell you otherwise. That said, it’s essential that you can build your system autonomously, or nearly so.
- Forge your own path and build your own system.
This is of the utmost importance!
If you haven’t taken the time to create your own system, your rules (even if you borrow and compile them) and your plan, you will fail!
- PA analysis techniques cannot be ignored!
In trading, you make money from one thing: betting on the repetition of technical setups.
That’s why your first trades and continuously observing the charts (even from afar) are part of your learning journey to becoming a profitable trader.
There you have 7 basic PA principles — never lose sight of them!
Price Action: Analysis & Interpretation
PA can be seen and interpreted using charts that represent price history.
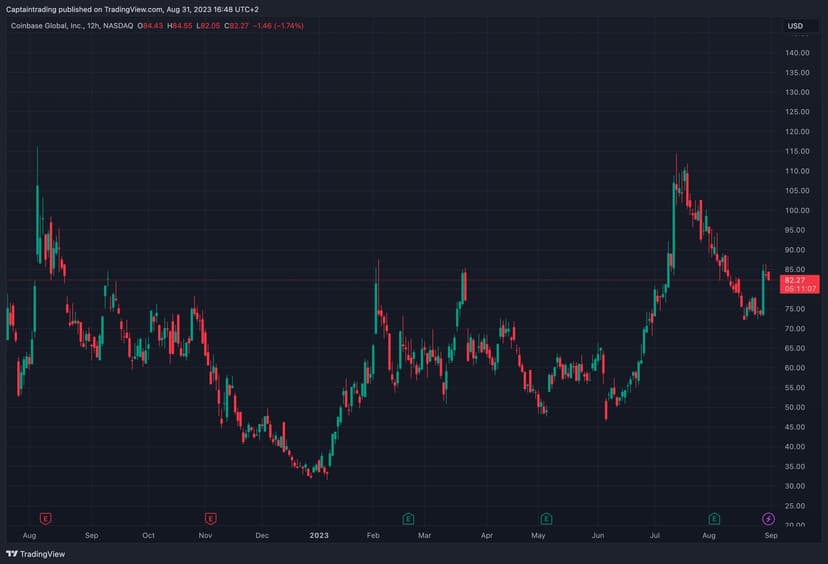
It’s normal and strongly recommended to combine different chart configurations to improve our ability to spot and interpret trends, breaks and reversals.
Using Japanese candlesticks is essential, in fact, because they let you better visualize price movements by displaying the open, high, low and close values in the context of up or down sessions.
On that note, Japanese candlesticks are a first concrete example of what Price Action really is.
How to Read a Japanese Candlestick

Japanese Candlestick Patterns

How to Profit from Price Action
Price Action isn’t a collection of tools like indicators; rather, it brings together the data sources from which our favorite tools are built.
With experience, you may have already noticed that indicators have in fact a lag, simply because it’s price movement that defines them!
Trend & Swing traders tend to work closely with Price Action, avoiding any fundamental analysis and focusing essentially on support and resistance levels to forecast moves.
That doesn’t mean you shouldn’t also pay attention to factors other than price.
The trading volume and the timeframes used to establish the levels also affect the probability that the interpretations and forecasts made through PA analysis turn out accurate.
Throughout your experience as a trader, you’ll discover which confluence factors are most useful to apply in the strategies you’ve put in place and come to favor.
Price Action: The Limits
Interpreting price movements remains fairly subjective.
First of all, you need two participants to have a valid market: one side must be willing to sell and the other to buy.
What becomes interesting is that each party has its own reasons for acting in opposite ways at the same moment. It’s actually quite common for two traders to reach different conclusions when analyzing the same price movement.
The first may well see a continuing downtrend, while another may read a potential short-term reversal — but that’s just one example among many.
Of course, the timeframe used has a big influence on what traders see, because a security can perfectly well go through successive downtrends on the 1D while maintaining an uptrend on a broader timeframe.
In any case, it’s essential to remember that forecasts or predictions made from price movement, whatever the timescale, are above all speculative and can never be perfect.
The more tools you can apply to your trading hypothesis to confirm it, the better. I myself, along with all traders, call this “signal confluence”.
Price history is no guarantee of its future movement.
This interpretation of PA will surely help you understand why I always speak about my analyses and the predictions that follow from them in the conditional.
High-probability trades are still speculation because, even if you’re very good, your win rate will NEVER be 100%. That means every trader takes risks to gain access to potential rewards. That’s perfectly normal, and if that idea scares you, know that risk management is there to frame your losses so they stay minor.
Here are my tutorials on risk management!
Risk Management

Survive!
Among the pillars of a profitable trading system is risk management. Keeping rigorous risk management will let you minimize your inevitable losses and thus preserve your capital to make the most of your profitable positions!
Now let’s define a few basic concepts drawn from Price Action and see how to interpret them!
What Is Range Trading (or a Trading Range)?
Ranges are the zones where price consolidates after a period of marked trend. After an expansive move, you start looking for the formation of compressions that show up as range zones.
Graphically, this shows up as a horizontal price “channel”.
If range trading doesn’t interest you, you’ll end up missing out on 80% of the trading opportunities on the financial markets. Indeed, on average a market spends 4/5 of the time in a range, so it’s up to you. In any case, I’ve created a free range trading course for exactly that, so if it interests you, you can head there now — otherwise let’s move on… everything in its own time!
Price Action: How to Find and Define a Range
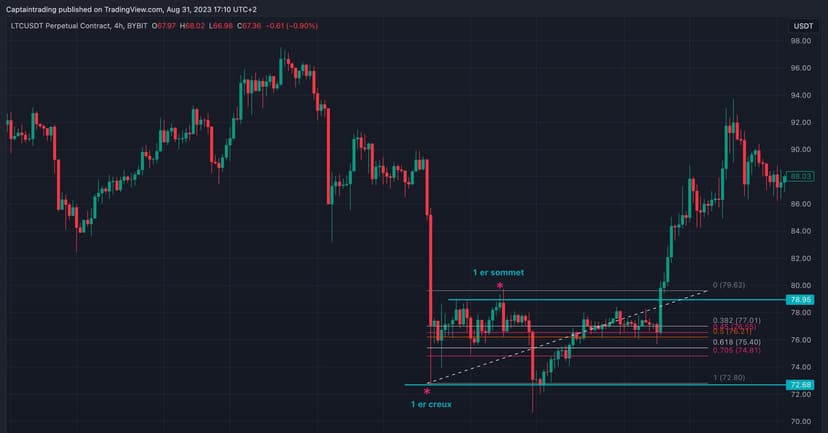
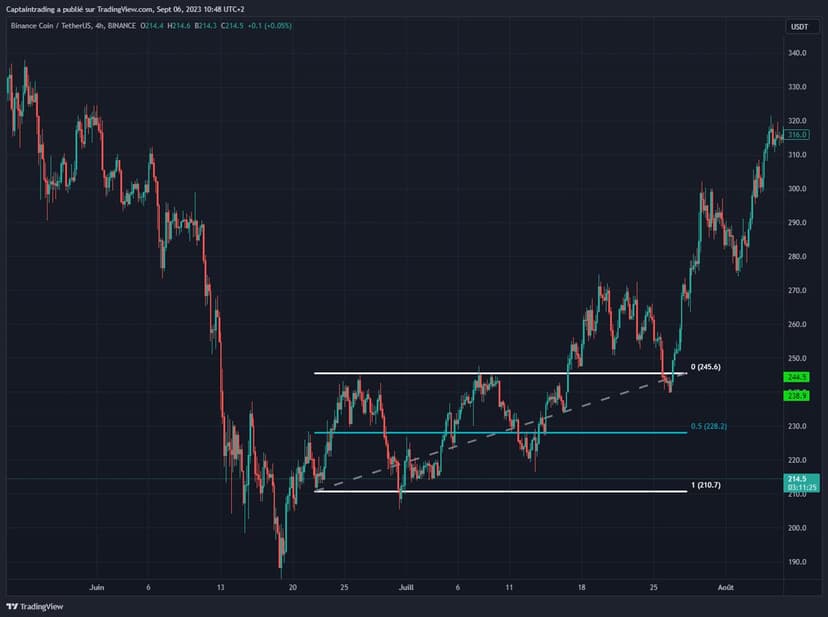
I. Wait until you can observe a complete move that meets the criteria.
A. Highlight the 1st High and the 1st Low.
or the other way around depending on the trend.
B. Highlight the 1st Low and the 1st High.
- It’ll never be perfect at first; that’s why it’s important to have another go as many times as needed to start becoming more effective, build your confidence and, above all, find points of confluence!
Careful: looking for points of confluence is no excuse to draw your “channels” however it suits you!
To avoid messing up, if you haven’t already, I encourage you to watch and rewatch my tutorial on support and resistance!
- You don’t define a range from just two high and low points. You need as many as possible so that your horizontal lines carry real meaning. It’s the lines that connect the most points that you should take into account!
II. Defining the Equilibrium level can be worthwhile!
When you know the range context of winter 2022 with BTC, you can only confirm this idea.
A. How does price react around the Equilibrium?
B. Is it really a technical point worth considering — are there reactions?
1. Candle close above the EQ = bullish
2. Close below the EQ = bearish
As you can see from the 2 examples above, there’s no perfect rule for defining a range. It’s perfectly normal to have several goes at it to correctly delimit a range when it’s just appeared.
Price Action: Reversal Patterns
During a range, support and resistance zones are zones of great interest to the market (see the concept of the liquidity pool).
It’s precisely in these price zones that a range’s reversal patterns can appear! These are essentially conventional reversal patterns that you can extend thanks to levels broken in the past.
What Should You Consider When Defining a Reversal Pattern?
Time and Space are the key!
> Just as with a support/resistance reversal, the greater the space and time before the retest, the more likely the reversal becomes.
A few tips to make the difference.
- It’s important to note that this type of reversal can occur on timeframes greater than or equal to H4 (adding confluent signals is essential)
- Support and resistance levels that haven’t been hit yet offer better probabilities
Bullish Reversal Pattern Example 1
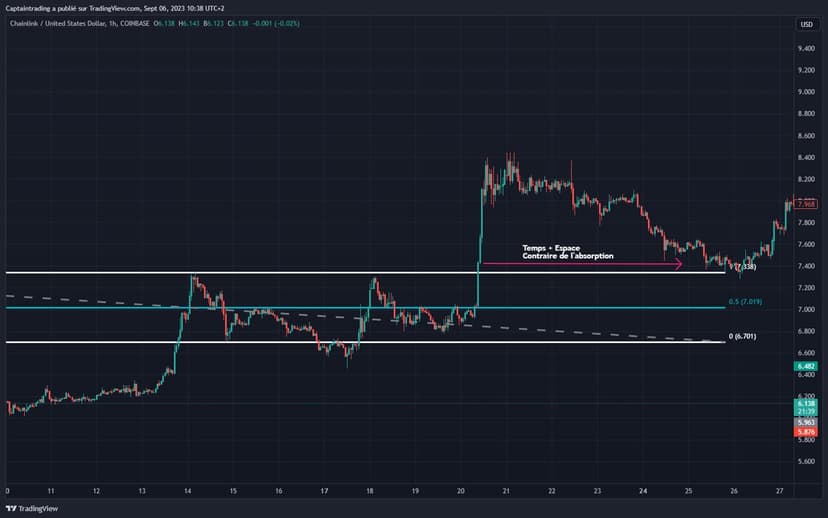
Bullish Reversal: Example No. 2
Ranges tend to offer entry opportunities with strong potential for success. That holds as long as we can follow the structure and the recent price action.
Price Action & Reversal: The 2 Key Elements
The market is always hunting for liquidity, and most of the time it bounces between the zones where it finds some before making an expansive move. Ranges are formed on this principle.
As a rough estimate, the market only shows a clear trend about 30% of the time, so it’s essential to know how to trade a range.
How to Profit from Ranges
I. Anticipate the formation of a range
A. Redraw your range as many times as needed until it’s exactly defined.
II. Every level of a range represents a “reaction” zone; start monitoring how your trades unfold if price approaches these levels.
- Define the top of the range
- Define the bottom of the range
- Define the Equilibrium
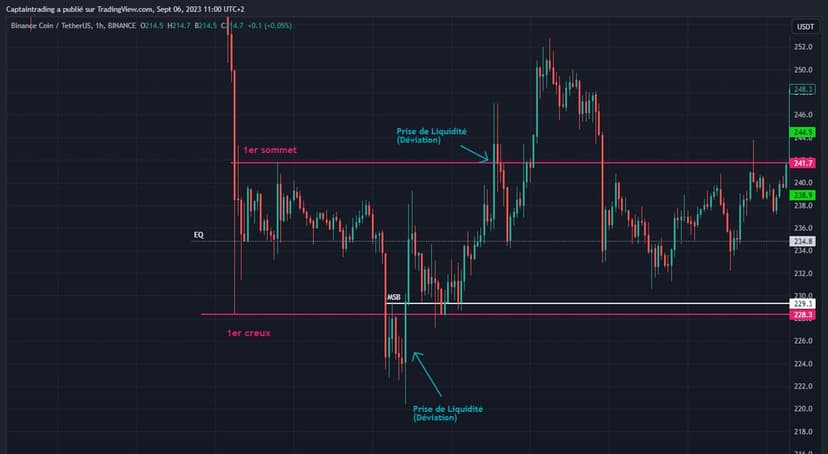
III. Make sure price has gathered enough liquidity before anticipating a move (see Chop Index)
A. Don’t get trapped
IV. Ranges give you the chance to change your bias regularly, since there’s no clear trend above 4H.
A. The probability boosters
- Directional bias via Market Dynamics
- MSB configurations and setups.
> Trading with HTF structures (TFs > H4) ensures you’re not trading counter-trend. Trading in the direction of an HTF market dynamic’s trend considerably increases your chances of success.
V. Avoid betting on potential breakouts; I can’t say it enough! I don’t recommend it at all, because violent moves can occur once the SLs are triggered at the range’s extremes.
VI. Clearly define the significant supply and demand zones; price tends to be drawn toward liquidity if it’s near the range. It’s then common to see price move back into its range.
VII. Here’s a golden rule as long as the range isn’t broken:
- Be Bullish but cautious at the lows.
- Be Bearish but cautious at the highs.
Price Action & Market Dynamics
Market Dynamics let you determine the flows that govern the market. According to most traders, it determines the direction of the trend.
Market dynamics let you stay in sync with the market and thus avoid counter-trend trading, which increases the probability that your positions work out.
The 3 Market Phases:
- Uptrend | Expansion
- The Range | Accumulation or Distribution
- Downtrend | Contraction
Remember that the market only follows a clear trend about 30% of the time. The remaining 70% are ranges..
Price Action: Uptrend Definition
It’s defined by a series of successively higher highs and higher lows.
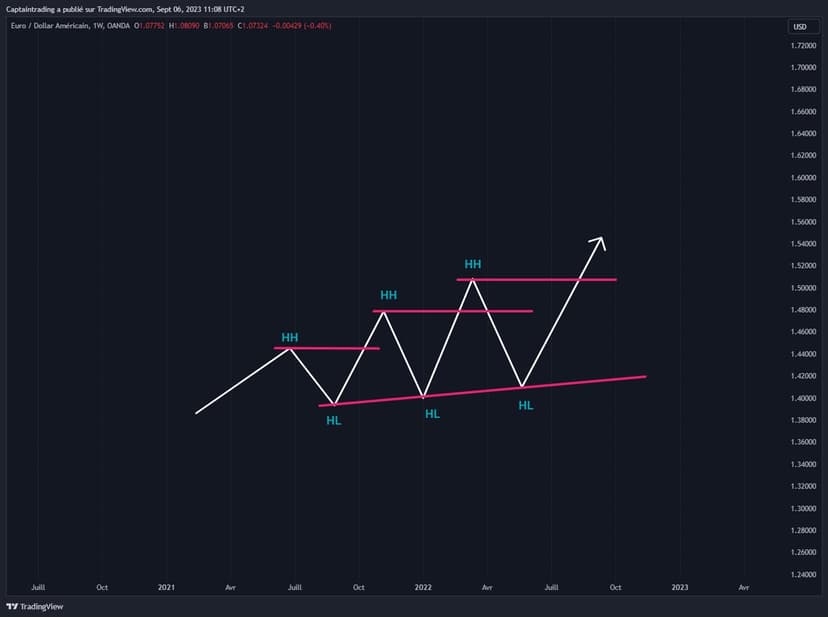
For an uptrend to stay intact, it must keep its ascending structure. Higher lows must be followed by higher highs. The trend isn’t called into question if the highs come in lower, provided you see a compression phase or an accumulation-type setup.
Price Action: Downtrend Definition
A series of successively lower highs and lower lows.
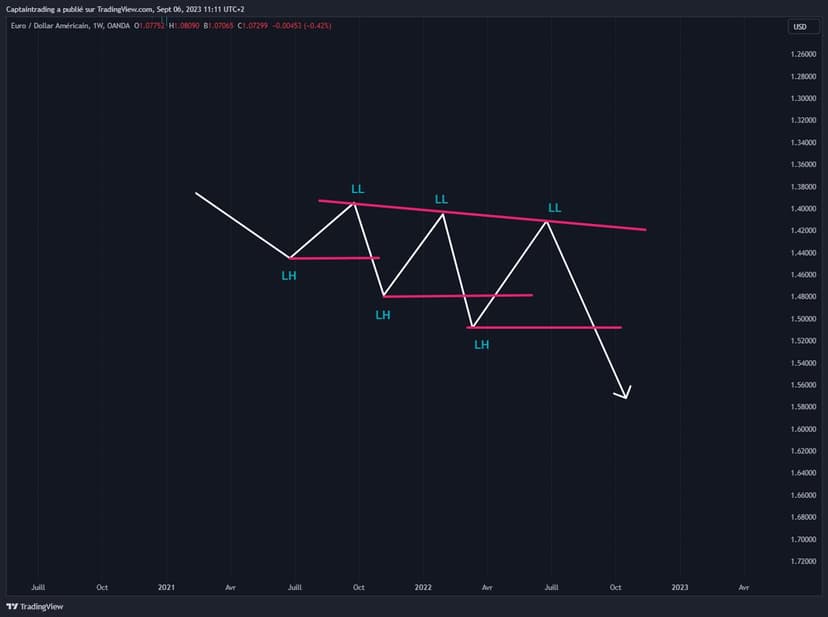
Conversely, a downtrend is defined by a series of respectively lower highs and lower lows. Likewise, the trend stays intact as long as you keep seeing lower highs. Higher lows are acceptable provided you anticipate a redistribution phase.
Price Action: Trading Range Definition
As defined earlier, a range is characterized by a zone in which price bounces between a resistance and a support clearly defined by numerous tests.
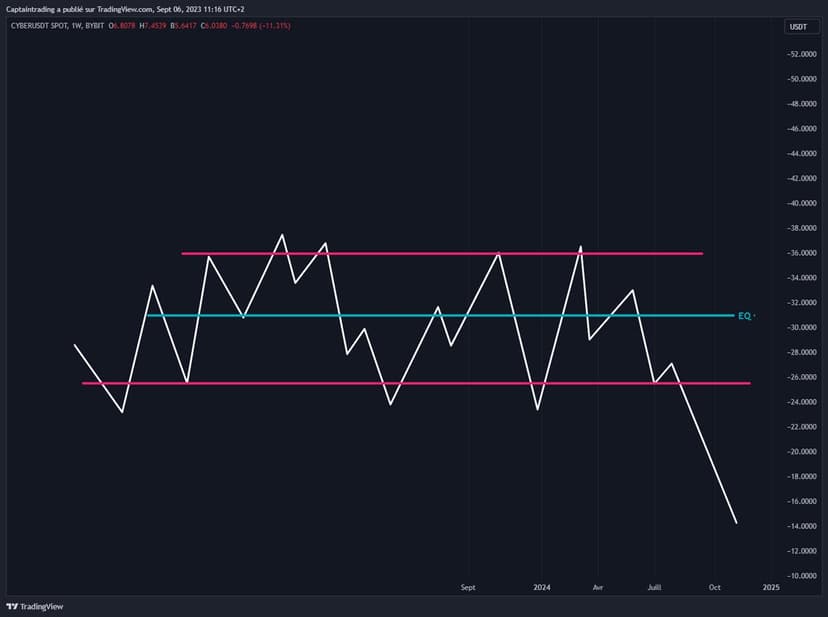
After a period during which the trend was clearly expressed, the “price re-accumulates” or “distributes” ( see Wyckoff ) usually through a period of range.
Price Action & Market Structure Break, or MSB
A break in the dynamics tells us the market has shifted from one trend to another. From then on, we can adjust our bias and trade accordingly — that is, in the direction of the trend!
How Can You Be Sure the Dynamics Have Broken?
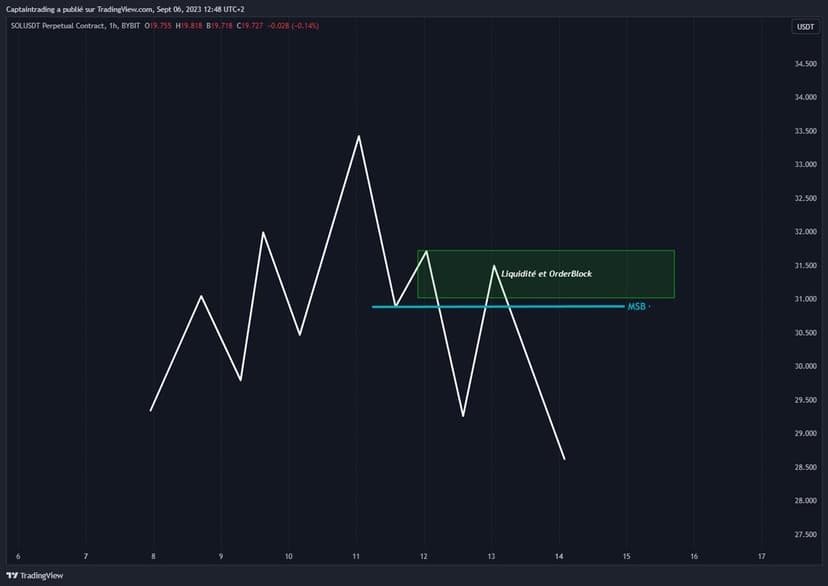
Here’s the diagram of a downward break in the dynamics.
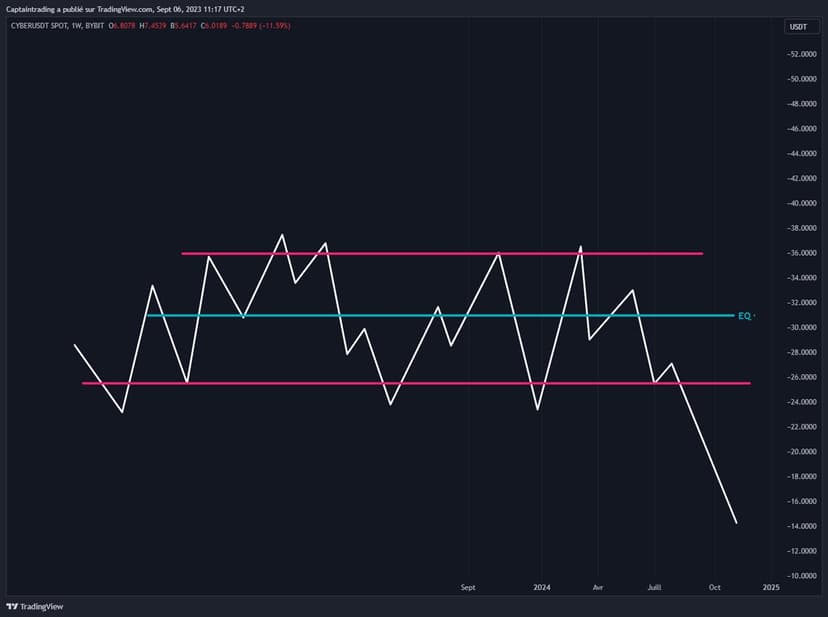
Price shifts from an uptrend to a downtrend.
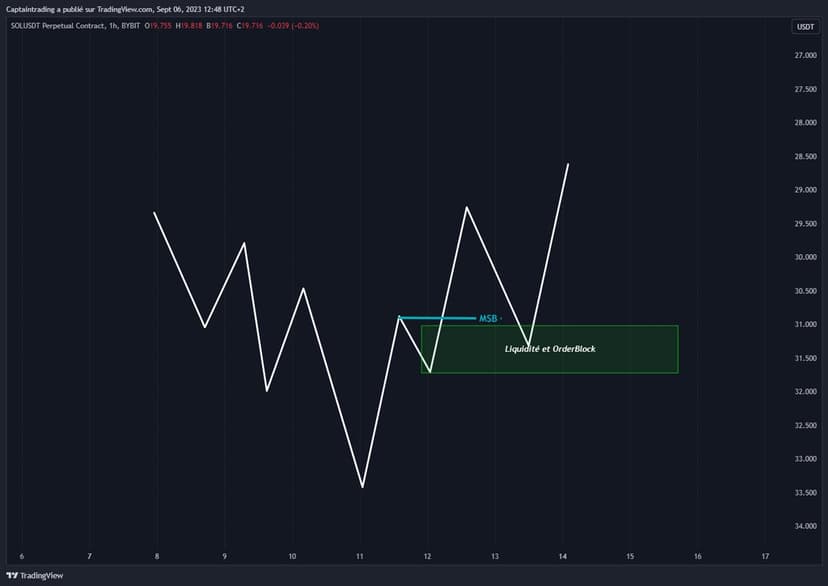
Here’s the diagram of an upward break in the dynamics.
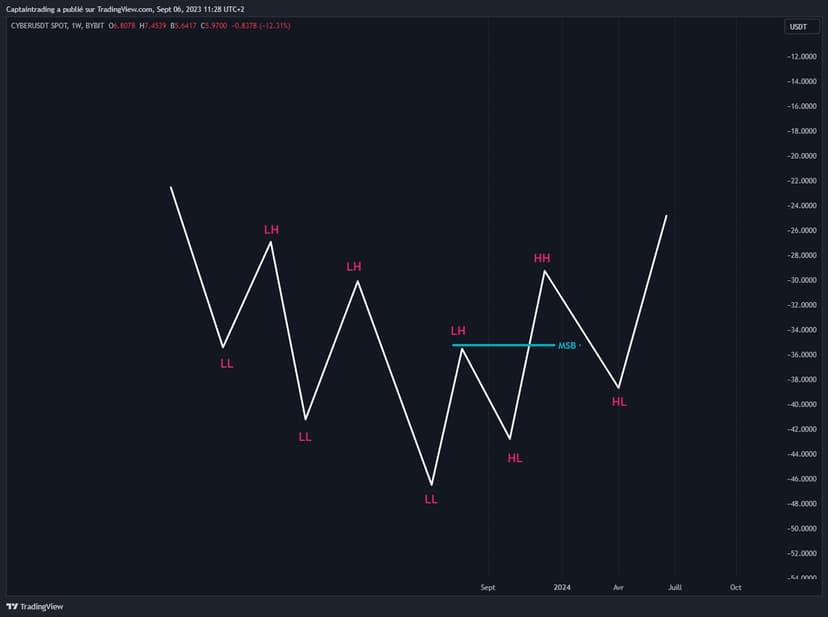
Price shifts from a downtrend to an uptrend.
How to Avoid Getting Trapped in a Fakeout or False MSB?
- For an MSB to the upside, you need a closing price above the previous lowest upper wick.
- For an MSB to the downside, you need a closing price below the previous highest lower wick.
My advice:
Don’t overthink defining the highest lower wick, or vice versa, because as usual, if it doesn’t look obvious to you, that’s a bad sign! That said, in theory, here are the criteria to define them below.
The Criteria to Validate the Lower High
- It must be a “Swing High”: a higher candle in the middle of two lower candles.
- It must absolutely lead to a new lower high or equivalent
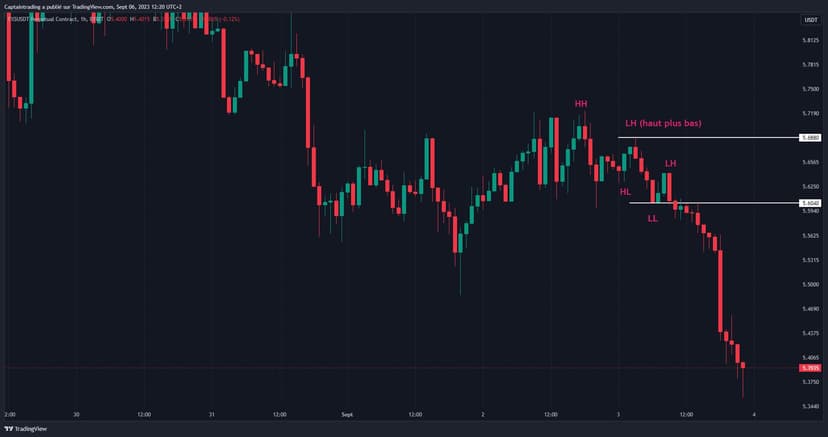
Here Are the Criteria to Validate the Higher Low
- It must be a Swing Low.
- It must lead to a higher low or equivalent.
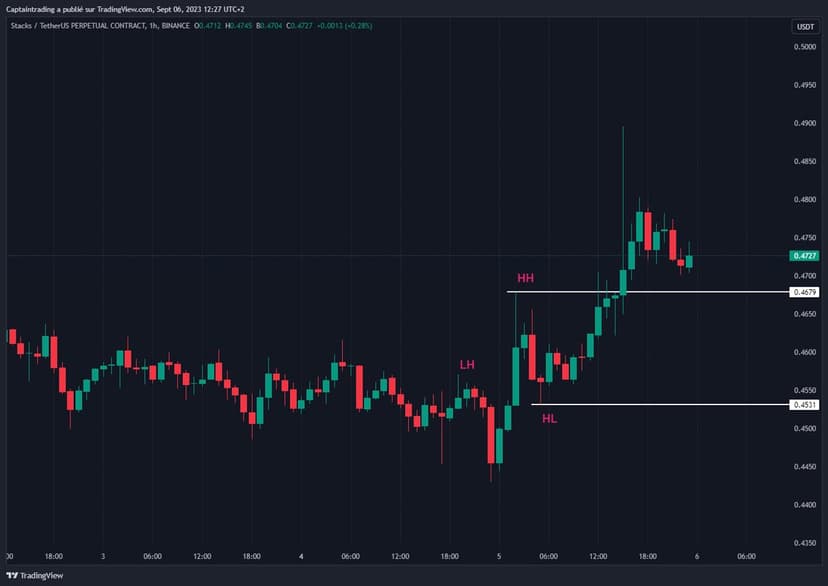
Additional Notes:
To anticipate the Price Action to come, observe how the current structure evolves.
When it’s an uptrend:
- Do you notice price making higher lows but failing to make higher highs?
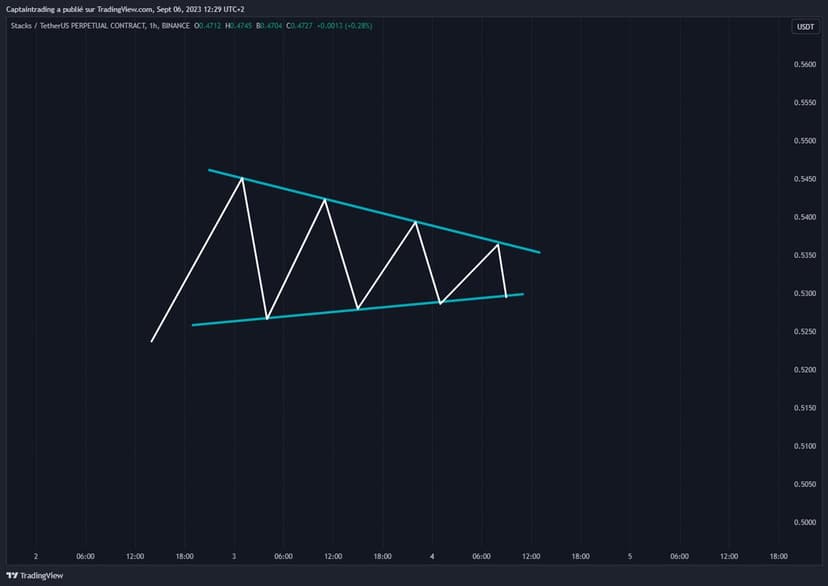
If so, it’s a sign of compression ( the Chop is starting to build back up )
- Is price struggling to make higher lows while you notice lower and lower highs?
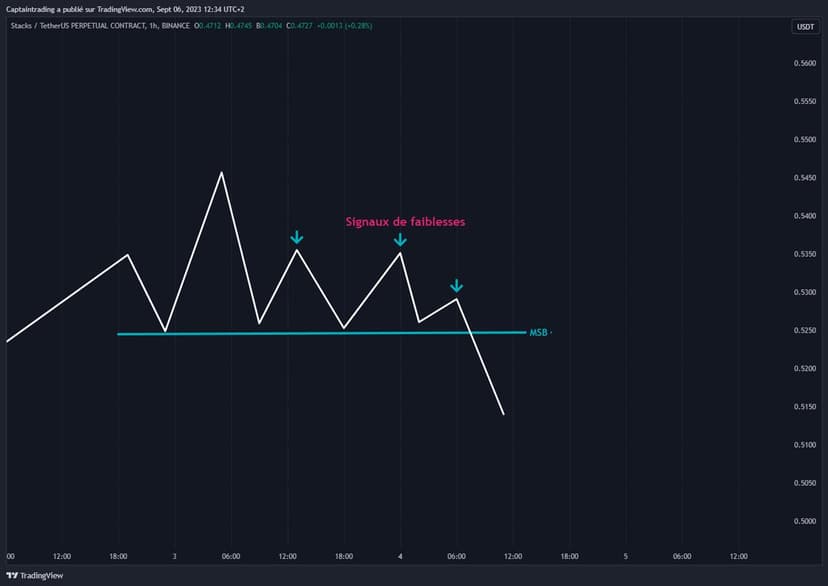
If so, these are potential reversal signs.
When it’s a downtrend:
- Do you notice price making lower highs but failing to make lower lows?
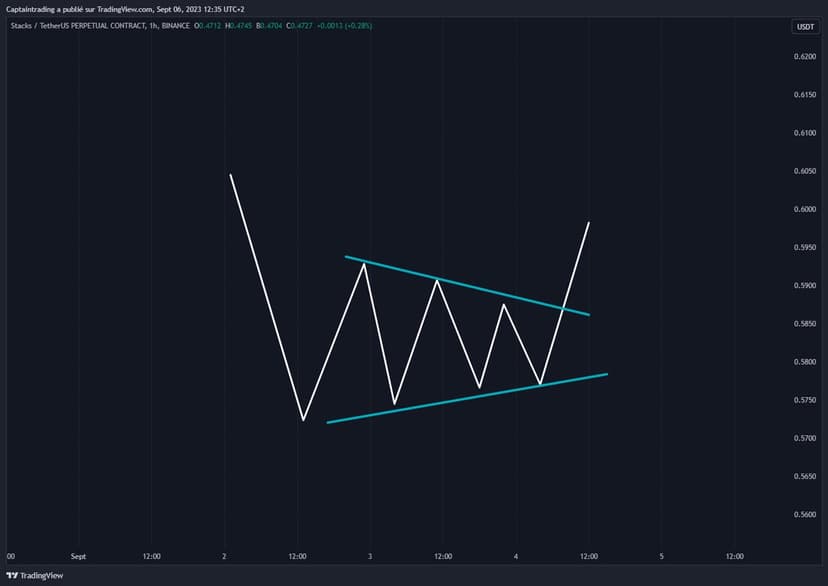
If so, it’s a sign of compression ( the Chop is starting to build back up )
- Are you seeing higher and higher lows?
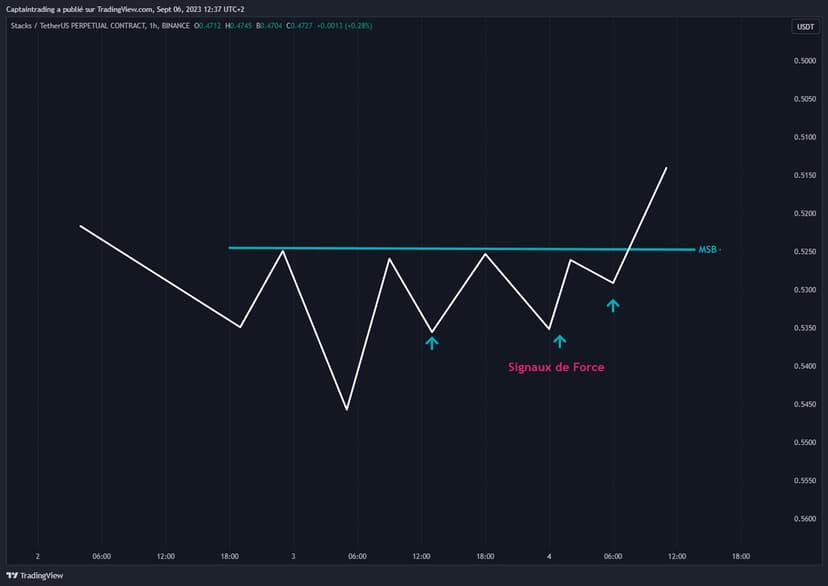
If so, it’s a reversal signal.
Support and Resistance, the Foundation of Price Action!
Significant support and resistance zones can also become pivot zones. Whether it’s a psychological level such as a round number, or zones highlighted thanks to Fibonacci, these zones are of great interest to a trader. Indeed, these zones represent prices the market finds interesting, so you can anticipate the reactions once price touches those same zones!
I don’t think support and resistance zones alone constitute genuine signals. However, it’s essential to keep them in mind — or rather on screen — so you can derive confluence zones by crossing different indicators.
The order blocks found on support and resistance zones give us high-probability setups.
This lets you place orders in anticipation of a reversal far more effectively.
What’s more, you’ll regularly find substantial liquidity there, used in vain by the “Composite Operator” ( see Wyckoff )
So you think you’re capable of getting the better of the institutions by anticipating their behavior?! Because that’s exactly what this is about!
I’d add, though, that your goal must absolutely remain increasing your probabilities of success, and that goes through anticipating the behavior of the Composite Operator, the institutional players who drive the market thanks to their considerable capital ( to keep it simple )
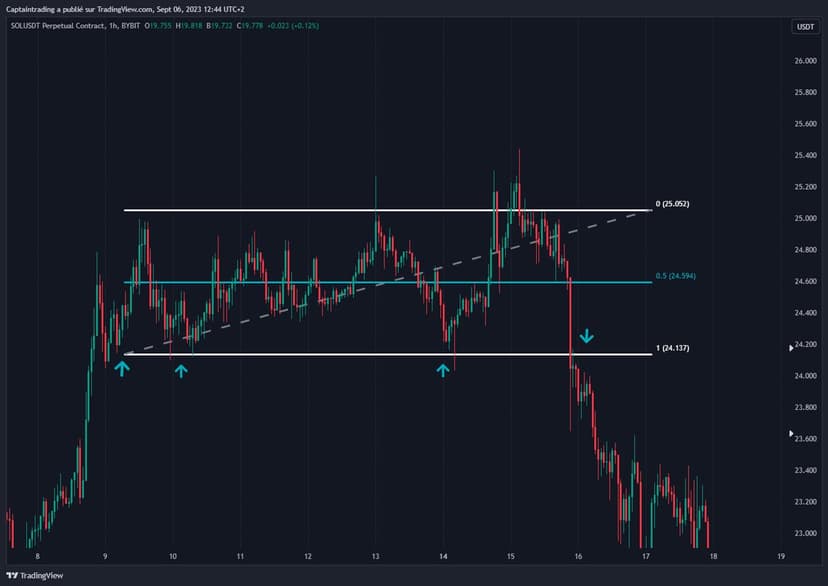
Don’t forget:
Consolidation phases above a support are a Bearish signal.
Conversely, consolidation phases below a resistance are a Bullish signal
Close to the concept of Support and Resistance, we have:
- Liquidity pools ( S/D Clusters )
- The 1st Obstacle ( FO )
Now let’s move on to the concept of liquidity pools and, above all, how to spot them so you can add another string to your bow and one more potential confluence signal
In the meantime, here’s my tutorial on…. Support and Resistance.

Supply & Demand: Liquidity Pools and Order Blocks
The difference between support and resistance zones and zones of strong supply or demand is that the latter tend to be fresh, untouched points of interest that can potentially provide substantial short-term liquidity and thus, potentially, trigger a temporary reversal of the market.
As for resistances and supports, they’re horizontal lines that played a crucial role in defining previous prices.
So How Do You Spot Liquidity Pools?
Through ICT’s order blocks, for example — in other words, the price zones where you notice a cluster of large but fragmented sell or buy orders, with volume sufficient to reverse the market temporarily. Order blocks represent supply/demand zones very visually. On top of that, they offer precise entry points and easy-to-define invalidation points (see Stop Loss). By definition, liquidity pools and order blocks are the zones in which price is of great interest. Within an order block, liquidity is injected with a medium- or long-term plan, which is why reactions on contact with these zones are particularly powerful.
How to Define Order Blocks on a Chart?
An order block is generally expressed by a down or up candle near a key level that preceded an impulsive move up or down.
- A bearish order block is an up candle on, or at least near, a resistance level that preceded a strong downward impulse.
• A bullish order block is generally represented by a down candle near a support level that preceded a strong upward impulse.
Note, however, that not all “order blocks” are good to trade.
Here Are the Basic Criteria for Defining a Valid Order Block.
1. The OB must be located near a support or resistance on the significant timeframe
( or at least on a timeframe that defines a clear trend )
2. The OB must absolutely precede a break in market dynamics ( see MSB )
3. The imbalance that the order block precedes must be at least twice the size of the OB in terms of the magnitude of the reaction.
4. A validated order block should generally wipe out the opposing OBs, thereby adding extra impulse.
Here’s How to Spot Liquidity Pools and Order Blocks
A. Buy-Side Liquidity Pools
1. Make sure Market Dynamics are bullish on a significant timeframe.
2. Start by defining the points of interest according to your directional bias, via Support and Resistance.
3. Go back to the entry timeframe and start looking for order blocks around these levels.
4. A bullish OB generally appears with a final down candle before the strong expected bullish impulse.
Careful: here it’s important to stay as close as possible to the theoretical framework and respect the definitions in your practice, namely the 2 processes and each of the 4 steps that go with them.
B. Sell-Side Liquidity Pools
1. Make sure Market Dynamics are bearish on a significant timeframe.
2. Start by defining the points of interest according to your directional bias, via Support and Resistance.
3. Go back to the entry timeframe and start looking for liquidity pools around these levels.
4. A bearish OB generally appears with a final up candle before the strong expected bearish impulse.
Obviously, practice is never as simple as theory, so before you start seeing liquidity pools below every resistance, check and double-check the validity criteria, because they’re essential.
Here, this is purely the theory defined by ICT; I won’t dwell on the examples and I encourage you to read up on the subject if this point interests you.
Personally, I have a slightly different method.
That said, I keep studying these precepts closely so I can soon draw conclusions from them that might interest you!
What’s important to take away here is that, just like any indicator, it can contribute to points of confluence with our usual indicators. So it can be worthwhile to dig deeper into the order block concept.
Choosing Your Timeframes
Having a directional bias is essential in trading. That said, it’s perfectly normal for price to show different trends depending on the timeframe you choose.
That’s why it’s important to have a directional bias: to configure how the trend is defined according to your style and thus place your orders in line with the trend you’ve defined.
This simply lets you increase your chances of success. As you surely already know, it’s not advisable to trade against the trend, because genuine reversals are quite rare and can’t make up a large share of your trading plans.
Careful: this isn’t about finding the most perfect lows and highs, it’s simply about optimizing your R:R.
To simplify a first approach, here’s a table of timeframes that it’s recommended you pair up according to your style ( Swing or Intraday, for example )
How do you pair them according to your trading style? You always combine three timeframes: one for context, one for bias, one for entry.
Here’s how to go about it! The faster and more aggressive your trading, the lower you start in the table. As you’ll have gathered, the lowest TFs are mostly reserved for scalpers…
1. Define the Market Dynamics
In the case of Scalping, we’ll work on the H1
2. Define the key levels without forgetting the hierarchy between timeframes, moving from the highest to the lowest and never the other way around.
3. Define the directional bias
In the case of Scalping, we’ll use the M15 timeframe here
4. Define the key levels: Support, Resistance and liquidity pools.
5. Finally, refine your entry using one of the smallest timeframes: M5 M3 M1
Solution 1: If your directional bias is bullish, you’re looking to place long orders.
Solution 2: Your directional bias is bearish, so you’re looking for short opportunities!
As usual, theory is far simpler than practice; every rule has already been broken and no trader has a 100% success rate.
With timeframes, it’s a little different: if you stray from the rule, it’s usually almost certain you’ll be off the mark most of the time!
This short passage above is actually one of the most valuable in this guide, because if you master it, it’ll bring you closer to a professional view of trading. What’s more, it gives you an ultra-stable foundation that’s required to progress and acquire real skills.
Dear friends…
This is where this introduction to Price Action ends ( for now )!
Don’t be like the passive majority when the market’s looking grim; be one of those who anticipate the market’s moves, up and down, and take advantage of it!
Every guide here is free. Browse the full course and join a community of traders who share ideas every day.