Fibonacci was the nickname of the Italian mathematician Leonardo Pisano. He was born in Pisa in 1170. In his youth, he studied mathematics in the port of Bugia (now located in Algeria). Over the course of his many travels, he learned the Hindu-Arabic numeral system. In the Fibonacci sequence, after 0 and 1, each number is the sum of the two before it. When you use Fibonacci retracements in your technical analysis, the numbers used in Fibonacci retracements aren’t the numbers of the Fibonacci sequence itself. Instead, you use the mathematical relationships between the numbers in the sequence. Like most of the technical indicators I use, Fibonacci is available on TradingView.
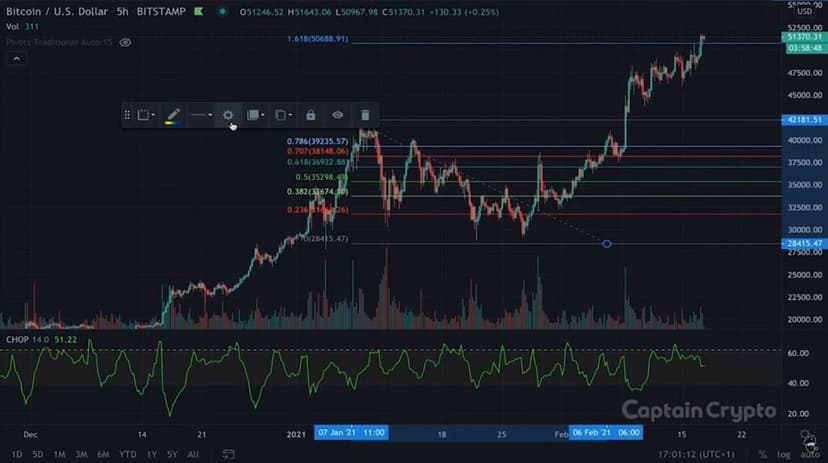
You draw Fibonacci retracement levels by identifying the highest and lowest points of a move. This creates a grid that marks the Fibonacci levels horizontally. These horizontal lines are used to identify reversal and trend zones. By cross-referencing them with our support and resistance, you can find points of confluence and, therefore, meaningful and reliable signals! Fibo is far from a tool to overlook… When I take a look at my trading journal, I’d say more than half of my technical analyses incorporate the Fibonacci sequence. It’s a perfect complement to the Price Action methods.
Fibonacci: The Sequence and the Golden Ratio
The golden ratio (also called the golden section, golden proportion, or divine proportion) is a ratio, originally defined in geometry as the unique ratio a/b between two lengths a and b such that the ratio of the sum a + b of the two lengths to the larger one (a) equals the ratio of the larger one (a) to the smaller one (b).
This irrational number is the unique positive solution to the equation φ 2 = φ + 1. It equals: 1.618
This value 1.618 is called the golden ratio.
In 1202, upon his return to Italy, Fibonacci shared his discoveries in the Book of Abacus. This book describes the numerical sequence that would come to bear his name: 0, 1, 0+1, 1+1, 1+2, 2+3, etc.
That is: 0, 1, 1, 2, 3, 5, 8, etc.
This sequence grows very quickly toward infinity. Each number is approximately 1.618 times larger than the one before it. This divine proportion appears mysteriously in nature, in architecture, in painting, and even in biology. You’ll find it, for example, in the structure of the Parthenon, in heliotropes, rose petals, and so on…
Fibonacci: How to Use the Sequence in Technical Analysis
In trading, the numbers used in Fibonacci retracements aren’t numbers from the sequence of the same name. The retracements are derived from mathematical relationships between the numbers in the sequence. By dividing a number in the Fibonacci series by the number that follows it, you get the famous divine proportion of 61.8%
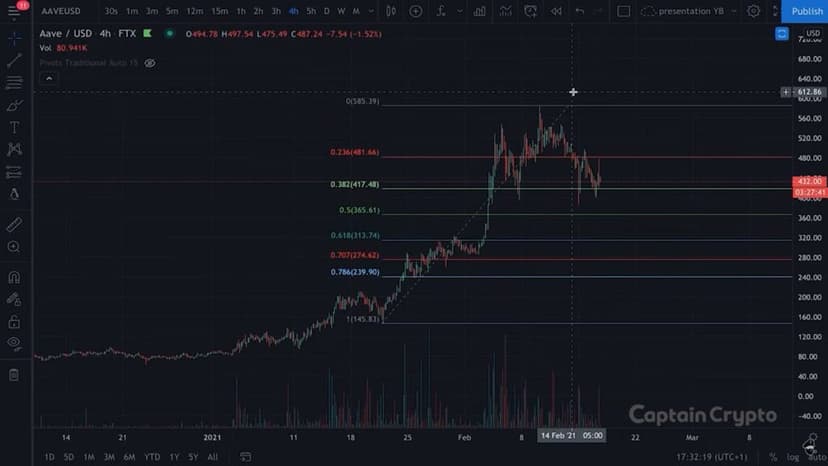
The levels are defined by taking the high and low points on a chart and marking the key Fibonacci ratios of 23.6%, 38.2%, and 61.8%. The horizontal lines are used to identify possible price reversal points. The 50% retracement level is normally included in the grid of Fibonacci levels, which can be drawn using software that displays the price action of an asset on a chart, such as Tradingview. The 50% retracement level doesn’t correspond to any Fibonacci number. Even so, traders generally view it as an important potential reversal level. It appears notably in Dow theory as well as in the work of W.D. Gann. In range trading, I often use it to determine the “mid-range”.
An Essential Tool for Your Trading Strategy
You’ll regularly use Fibonacci retracements when building trend trading strategies. From this angle, traders watch a retracement unfold within a trend and try to make low-risk entries in the direction of the original trend using Fibonacci levels. Traders who use this strategy expect that a price has a high probability of bouncing off the Fibonacci levels in the direction of the original trend.
Spotting a cluster of technical clues, combined with the price reaching a Fibonacci level, strengthens the probability of a trend reversal. Chart patterns formed by Japanese candlesticks, trendlines, volume, momentum oscillators, and moving averages are the main technical indicators used together with Fibonacci levels. The more indicators you find confirming the reversal signal flagged by the retracement tool, the higher the odds that this reversal actually occurs.
Traders use Fibonacci retracements with many financial instruments, notably stocks, commodities, and foreign exchange (Forex). They use them across different timeframes: monthly, weekly, daily… However, as with other technical indicators, the predictive value is proportional to the timeframe used. The higher the timeframe, the better the prediction. For example, a 38.2% retracement on a chart based on the weekly timeframe is a far stronger signal than a 38.2% retracement on a chart showing five-minute candles.
How to Use Fibonacci Extensions
The pros use Fibonacci to forecast potential support or resistance zones. They can also enter the market on a “pullback” before the trend resumes. Fibonacci extensions then let them set profit targets that are likely to be reached. These extensions consist of levels projected beyond the standard 100% level. Traders use them to anticipate price action in an uptrend or a downtrend and to identify potential “take profit” or “stop-loss” zones. The main Fibonacci extension levels are 161.8%, 261.8%, and 423.6%. As a reminder, for the practical use of the Fibonacci sequence, I’ve made a free course on YouTube, available below.
My Conclusion on Fibonacci
The Fibo sequence often points to reversal levels with an uncanny accuracy: time and again, it “lands right on the money”! That said, these levels are harder to trade than they look. Plotting them only becomes effective as part of a broader strategy. Ideally, that strategy looks for the confluence of several signals, a cluster of clues meant to identify potential reversal zones. This offers low-risk entries with strong return potential! If you enjoyed the theory, you’ll enjoy the practice just as much!
A pullback into a Fibonacci level gives you the spot; the stop beneath it gives you the risk; the position size is the part that still needs calculating — the whole subject of our Trade Assistant guide, for anyone trading on MT4/MT5.
Fibonacci: Also My Most-Watched Tutorial on YouTube!

Every guide here is free. Browse the full course and join a community of traders who share ideas every day.