Trading Journal: Definition
A trading journal is the log where you record every trade you take: what you planned to do, what you actually did, and the gap between the two. It’s not a diary of memories — it’s your measuring instrument. Without it, you’re not in control of anything — you’re improvising and hoping.
I’ve kept mine for almost ten years now. Without hesitation, it’s the tool that has changed my results the most — well ahead of any technique. In this free course, I give you exactly the method I use, my templates to copy, and how to use them every day.
Key takeaways:
- A trading journal records every trade: what you planned to do, what you actually did, and the gap between the two.
- The complete method fits in 5 steps: daily plan, statistics journal, key levels, safeguards, business plan.
- It’s a detector of repetitive mistakes: my own journal showed me that 70% of my early entries weren’t profitable — that’s what made me stop.
- The template is free, no sign-up required, in two formats: Excel (.xlsx), ready to upload to Google Sheets, and a printable PDF.
- The real lever isn’t the daily logging but the weekly review: 20 to 30 minutes every Sunday is all it takes.
The data my trading journal contains:
- Money management
- Risk management
- Trading account used (and on which platform)
- Day trading / Swing trading / Scalping
- Trading system and strategy
- Spot or derivatives: perpetuals and futures contracts, options…
- Bias: the observed trend
- Timeframes
- Entry and exit points: take profit and stop-loss
- Performance: net P&L and return in R
Journal, Plan, System: Don’t Confuse the Three
It’s the most common mix-up, and it’s costly because it makes you think you have a journal when you actually have nothing at all.
| Tool | It Answers | When |
|---|---|---|
| System | How do I trade, in general? | Built once, evolves slowly |
| Trading Plan | What am I doing on THIS trade? | Before every position |
| Trading Journal | What did I do, and why? | After — then reviewed every week |
The system is the doctrine, the plan is the mission order, the journal is the debrief. The three feed each other: it’s the journal that tells you what to fix in your plan, and it’s the accumulation of corrected plans that evolves your system.
Why Keep a Trading Journal?
Because without data, you can’t know whether what you’re doing actually works. You can get lucky for two months and believe you’ve found a method. Only a serious sample size tells you what you’re really worth in the market.
A trading journal is a time machine: it lets you revisit, at any moment, your trades and their results, your strategy, your mindset, and market conditions before, during and after the position.
In concrete terms, it lets you:
- Identify which strategy is actually profitable among the ones you use
- Measure the impact of your emotional state on your performance
- Spot the hours and sessions where you’re systematically less effective
- Build conviction based on data, not impressions
The Number My Own Journal Revealed
For years, I had one stubborn flaw: entering before my plan. I’d written everything down, my level was marked, and I’d get in 30 $ higher, afraid the price would never come back for my entry.
Going back through my sheets, the verdict was final: in 70% of the cases where I touched my entry point, it wasn’t profitable. Had I stuck to the plan, the price would have come back for me and I would have won the trade cleanly.
Nobody could have given me that number. Not a coach, not a video. It came out of my own sheets, and that’s exactly why it worked: our brain doesn’t react to advice, it reacts to facts we’ve produced ourselves. The day you know in black and white how much a mistake has cost you, you stop making it. Not before.
The 3 Pillars: Technique, Management, Mindset
To make a living from trading, you need to hold up three pillars, and they matter almost equally to one another:
- Technique — your setups, your patterns, your market reading.
- Management — risk management, adapting to market conditions, trade management.
- Mindset — planning, routine, execution and performance analysis.
Most people only work on the first one. That’s a mistake: there are very simple techniques that pay off, if you have the discipline to apply them. Mindset, though, is the only pillar nobody will work on for you. If you don’t plan, if you have no routine, if you don’t analyze your performance — it won’t happen on its own.
And the three form a virtuous circle: the journal feeds the mindset, the mindset improves execution, execution generates statistics, and statistics evolve technique and management. That’s the circle we set in motion here.
My 5-Step Method
I’ve summarized in a video the complete framework I apply every day. It’s the flaw I’ve identified in almost every trader I’ve come across in six years: it’s never the strategy, it’s behavior.

Step 1 — The Daily Plan
I don’t know a single professional who doesn’t prepare his day on a sheet. It’s the heart of the journal, and it’s also standard practice at the historic London prop firms: the trader prepares his plan, presents it, and it’s on that basis that management releases capital to him. Not on a hunch.
What I write down in the morning:
- Market sentiment. What’s my counterparty doing today? Are they euphoric, panicking? You need to know who you’re up against. The Fear & Greed index and open interest help you decide.
- The daily bias. One line, not a novel. “Range BTC/ETH, alts strengthening, dominance falling.”
- Key levels for each asset being watched (see step 3).
- Open positions, with their exit target already written down. That way I don’t ask myself mid-session “should I close?” — when the target is hit, I execute. If I’m keeping a runner, it’s noted, and I know I need to watch it.
What I write down in the evening: net P&L, the return in R (how much I risked for how much I made), and above all the confrontation. What I’d planned versus what actually happened. Where I called it right, where I called it wrong. Then one positive, one negative, the why, and one point to rework tomorrow. There’s always a point to rework.
Step 2 — The Statistics Journal
This is what’s called the track record. You won’t work anywhere in finance without a track record — and even if you have zero desire to work at a bank, you still have to face your own statistics. Understand the reality of your return. Without that, you stay in the abstract, and nobody makes money in the abstract.
What I look at: the number of trades, winners and losers, the win rate, and above all the overall return — because a win rate without a return is worthless. Then the curve over a year, drawdowns included.
On my own curve, there’s a long drawdown period. I know exactly what it corresponds to: my daughter being born, plus a particularly moody market phase. What let me bounce back wasn’t some miracle new setup — it’s having had enough statistics to trust my system and refocus on my methodology, with razor-precise risk management. When you only risk a set percentage per trade, a drawdown period is something you get through.
One point on sample size: with ten trades, you know nothing. You can be lucky for a while and then not anymore. Only a large volume of data tells you what you’re really worth.
Step 3 — Defining Key Levels
This one’s crucial, and I do it every day in front of my students. I call these commitment levels: prices where I know that, if we get there, I’ll be looking for a specific piece of information — absorption, a false breakout, a genuine breakout, a reclaim.
I get them from order flow, market profile and volume profile, closes, and a bit of price action. My methodology isn’t better than anyone else’s — but you need one, and it has to produce levels written down in advance.
I’m often criticized for giving “two-way scenarios”: if the market goes to grab 75 K, I want to buy; if it loses 73 K, I want to sell. That’s not saying “it’ll go up or it’ll go down.” It’s saying that at that exact spot, I’ll go looking for a piece of market information, and I already know what I’ll do with it. The rest of the time, I don’t trade.
That’s what saves me from mistimed entries and overtrading: I don’t trade outside my key levels. If I want to take a trade outside the plan, I first have to establish the level. It’s drastically changed my results.
Step 4 — The Safeguards (circuit breakers)
This one keeps you out of bankruptcy. Trading is the only field where you’re allowed to do absolutely anything: open a position with your entire capital and lose it all in one second. If you don’t impose rules on yourself, it’s almost guaranteed to end badly.
I learned this the hard way. I finished 83rd on the leaderboard in 2024, so I know what it’s like to win big — and it goes to your head fast. I also know what it’s like to lose everything: I lived through it with FTX. My three rules:
- Only trade my key levels. Overtrading is having an excellent day and then wanting to chase the feeling of a winning trade — and giving back part of your gains on a trade that makes no sense. Add it up, and it comes to enormous amounts.
- Double my vigilance after a winning day. That’s the most dangerous one. I control myself very well on losing days; it’s on winning days that I used to give the money back. I focused 100% of my attention on that one mistake, and it’s almost disappeared.
- Three stop-losses in a day = full stop. It’s extremely rare that after three stops I take another trade. Often, I switch activities entirely, do something enjoyable, and remind myself why I do this. When you lose, there’s a bitterness left over that, the next day, pushes you to make more mistakes.
After several losers in a row, the goal isn’t to “chase your losses”: it’s to get the winning feeling back, because winning attracts winning. You reset, redo a clean daily plan, and wait for the right moment. If this is something you struggle with, the guide on managing stress in trading and the one on trader psychology go further into it.
Step 5 — The Business Plan
The last step is to treat trading as a business, not a hobby: goals, capital, profit-taking strategy, income sources, taxes, equipment. Impossible to cover in ten minutes — I devoted an entire bootcamp of more than two hours to it, “Vivre du Trading”, the gist of which is actually summarized on this page.
One point I go into detail on there, and that isn’t said enough: pay yourself regularly. On an account that started at 3,000 $, I generated 27,500 $ in a month — but I paid myself the whole way through. The final capital is smaller than if I’d let it all compound, that’s true. In exchange, the gains are secured and out of the market. I’ve already watched an exchange walk off with the entirety of my funds; I don’t stack up virtual numbers anymore without ever getting real use out of them.
My Trading Journal Template to Download
Here’s the file I use. Four tabs, designed to fit together: the daily sheet feeds the weekly recap, which feeds the monthly recap, and the error tracker catches what comes up too often. It’s a free trading journal, no sign-up required: you copy it, you adapt it, it’s yours.
Download as Excel (.xlsx) · Download as PDF
Two formats, both in English: the Excel file (.xlsx) — upload it to Google Sheets if you would rather work online — and the PDF, for those who fill it in by hand — my favorite version for the evening review.
The goal isn’t to have exactly the same sheet as me: it’s to adapt it to your way of trading. But keep the structure — it’s what lets you look back on what you did, and that’s what makes the difference.
Tab 1 — The Daily Plan
Two checklists (morning and evening), the trade details, the day’s results, session expectations and conclusions. Here’s a filled-out trading journal example, from a real day:
| Morning Checklist | |
|---|---|
| Sentiment | Start of excitement |
| Daily bias | Range BTC/ETH — alts strengthening, BTC dominance falling |
| Key levels | 73,300 CVaH · 76,000 major resistance |
| Positions | BTC · XAG |
| Asset | Setup | Buy | Sell |
|---|---|---|---|
| BTC | SFP on key level | 73,300 | 75,500 (3/4) |
| XAG | Rejection on last MSB — SFP at range low | 74 | 84 |
| Trades | Best | Worst Loss | Total P&L |
|---|---|---|---|
| 3 | 1,244 USDT (1.5R) | — | 1,889 USDT · 2.8R |
And the part that really matters, the evening one:
| Open | Possible gap fill then correction. 4H chop loaded → big move to catch. |
| Close | The gap was almost filled. Start of the correction confirmed. |
| + Positive | Good anticipation of scenarios |
| − Negative | Got out a touch too fast |
| ? Why | Fear, because of the day before yesterday when the market crashed too fast |
| → Fix | Leave the runner alone no matter what |
Four lines. Positive, negative, why, fix. It’s the most important block in the entire file — it’s what turns a day into a lesson.
See the full structure of the “Daily Plan” tab
| Block | Fields |
|---|---|
| Morning checklist | Sentiment · Daily bias · Key levels · Positions |
| Evening checklist | Position listing · Conclusions · Overnight orders |
| Trade details | Asset · Setup · Buy · Sell |
| Day’s results | Number of trades · Best trade (amount and R) · Worst loss · Total P&L and total R |
| Session expectations | Open (what you expect) · Close (what actually happened) |
| Conclusions | + Positive · − Negative · ? Why · → Fix |
The three evening checkboxes aren’t decorative: as long as “Overnight orders” isn’t checked, the day isn’t closed. That’s what keeps you from going to bed with an unwatched position.
Tab 2 — The Weekly Recap
The weekly plan is exactly the same work, but summarized over the week. If you’ve filled in your daily sheets, it takes ten minutes to complete. If you’ve rushed through them, it’s worthless — it’s the best safeguard against skipping days.
| Day | Trades | W | L | Win Rate | P&L | R | Notes |
|---|---|---|---|---|---|---|---|
| Monday | 3 | 2 | 1 | 67% | +1,200 | 3.0 | Perfect daily plan |
| Tuesday | 2 | 2 | 0 | 100% | +1,500 | 3.2 | Perfect daily plan |
| Wednesday | 1 | 0 | 1 | 0% | −800 | −1.0 | Impatience, entered before the plan |
| Thursday | 2 | 2 | 0 | 100% | +1,450 | 2.8 | TPO reclaimed |
| Friday | 1 | — | — | — | — | — | Swing held over the weekend |
| Week: 9 trades · 67% win rate · +3,350 USDT · 8R | |||||||
Look at Wednesday’s row. A single day at −1R, and the cause is written down: “impatience, entered before the plan.” Over one week, that goes unnoticed. Repeated over three months, it’s what separates a growing account from a stagnant one. That’s precisely what the error tracker is there to catch.
See the full structure of the “Weekly Recap” tab
| Block | Fields |
|---|---|
| Market context | Weekly bias (bullish / bearish / neutral) · Structure · Key levels · Catalysts for the week (CPI, FOMC…) |
| Checks | Dailies reviewed · Trades logged · Equity curve · Goal met |
| Daily breakdown | Trades · Wins · Losses · Win rate · P&L · Total R · Best R · Notes |
| Results | Total trades · Win rate · P&L · Total R · Best day |
| Conclusions | + Positive · − Negative · ? Why · → Fix · Focus for next week |
Think of a timed athlete: to beat their time the following week, they don’t improve the whole course, they target the two turns where they lose seconds. The weekly recap does exactly that — it points to the two turns.
Tab 3 — The Monthly Recap
The daily plan assumes you trade every day; not everyone has that luxury. The monthly plan, though, everyone needs to do. That’s where you decide the strategy to deploy and the risk level — and I think about things completely differently after a winning month than after a losing one.
| Section | What It’s For |
|---|---|
| 1. Context of the month | Macro, state of the market, sentiment, narratives, overall bias |
| 2. Weekly breakdown | W1 to W5, same columns as the weekly |
| 3. Results | Trades, win rate, P&L, R, max drawdown, best day, best winning streak |
| 4. Frequent errors | The 2 most recurring mistakes of the month, no more |
| 5. Strategy to deploy | Allowed setups, markets, adapting to context |
| 6. Risk management | Risk per trade, daily, monthly, max leverage, size, hard rules |
| 7. Goals for the following month | Performance, process, mindset, learning |
| 8. Conclusions | Positive, negative, why, fix, key lesson |
| 9. M+1 and M+2 goals | The two-month outlook |
See the details of sections 4 and 6 (errors and risk)
Section 4 — Frequent error analysis. Two errors maximum, and for each, three lines:
- Root cause — why does this mistake happen? Emotion, lack of process, cognitive bias?
- Action plan — what are you changing concretely so you don’t repeat it?
- Success indicator — how will you know it’s fixed next month?
Two, not ten. When you have a dozen mistakes, you don’t bother with the small ones: you take the reddest one and deal with it. Trying to fix everything at once never works.
Section 6 — Risk management. The six dials to lock in before the month, not during it:
| Dial | Example |
|---|---|
| Risk per trade | 1% maximum |
| Daily risk | Stop trading after −2% on the day |
| Monthly risk | Max drawdown −5% → one-week pause |
| Max leverage | ×5, ×10 forbidden except on an A+ setup |
| Position size | Scaled up gradually, 3 simultaneous positions maximum |
| Hard rules | Never trade without a stop, no averaging down |
These figures are examples: calibrate them to your own situation with the risk management guide and your actual leverage.
Tab 4 — The Repeat-Offender Tracker
This one has served me enormously and still does. The principle is simple: one line per mistake, a cross for each repeat offense, and a column for what it cost you. Nothing more. But after two months, the table rubs your nose in it.
The cost column is the one that changes everything, and it’s also the most tedious to fill in by hand. If you use the site’s journal, it calculates itself: you check the mistake off on the trade, and the total in euros shows up.
| Mistake | Repeats | How Much It Cost Me |
|---|---|---|
| Inconsistent win/loss ratio | (8) | |
| Improvised plan | (4) | |
| Entry too early | (3) | |
| Moved entry point at a loss | (2) | |
| Didn’t size up enough | (1) | |
| Exit too early / too late | 0 | |
| Changed a plan mid-trade | 0 | |
| Sized up too much | 0 |
Once the two dominant mistakes are identified, you move to the action plan. Here are mine, with the exact fix I imposed on myself:
| Recurring Mistake | How to Stop Making It |
|---|---|
| Improvised plan | Mandatory pre-trade checklist before every position |
| Inconsistent win/loss ratio | Set a minimum 1:2 R:R in the plan, before entry |
| Entry too early | Wait for the structure candle confirmation |
| Moved entry point at a loss | Stick to the initial plan — 70% of the times I touched my entry, it wasn’t profitable |
A word on the win/loss ratio, because it’s my number-one mistake and it’s widely misunderstood. I’d set plans at 1.5R and exit at 0.4. The plan was good; it was the execution that didn’t follow through. On the flip side, don’t fall into the trap of the wild ratios you see floating around: stops stuck three ticks below a liquidity pool, with a proudly displayed 1:15 R:R. A trade isn’t meant to be perfect — sometimes you have to give it room to develop. If you’re consistently losing by a hair, go back two days later over the timeline: was the stop badly placed, or did the market genuinely run? Widening the stop without changing anything else about the strategy is sometimes enough to bring the win rate back up.
See the full list of tracked mistakes
- Inconsistent win/loss ratio
- Entry too early, too soon
- Exit too early, too soon
- Exit too late
- Moved entry point at a loss
- Changed a plan mid-trade
- Sized up too much (risk management)
- Didn’t size up enough
- Improvised plan
- One free line for your new mistake — there will always be one
Humans are very good at inventing new mistakes. Keep one line blank.
The Same Method, Automated on the Site
If spreadsheets put you off, there’s something simpler: this journal is built directly into the site, and it mirrors exactly the four tabs of the template. It’s free as soon as you create an account — no need to subscribe.
The daily sheet. The daily plan, as a form: sentiment, bias, key levels, watched positions and session expectations in the morning; what actually happened, positive, negative, why and fix in the evening. Plus the question that stings: “did I follow my plan today?” Your previous sheets stay available to browse — that’s the whole point.
Your stats, calculated on their own. You enter the trade (asset, direction, entry, exit, size, P&L, realized R, notes, tags), and the rest calculates itself: win rate, total result, average win and loss, profit factor, expectancy per trade, maximum drawdown and equity curve. Filterable over 30 days, 90 days or a year, exportable to CSV whenever you want — your data stays yours.
The repeat-offender tracker, quantified. On every trade, you check off what went wrong from a fixed list (entry too early, improvised plan, inconsistent ratio, trade outside key levels…). The site then does what the spreadsheet can’t: it adds up the losses from each mistake and tells you how much it’s cost you, in euros, then flags the one to work on first. That’s exactly the mechanism that made me stop entering too early: not advice — a number.
Add to that four calculators: position size, risk/reward, compound interest and liquidation price.
Spreadsheet or site, go with whichever one you’ll actually keep up. And if you want to know how I really do it: I keep a double journal, one of them handwritten. Writing by hand gets me away from the screen and forces me to slow down. It’s completely optional, but give it a try: a lot of people get a taste for it.
How to Keep a Trading Journal Every Day
The sole purpose of a trading journal is to give you, at any time, a clear and objective picture of every trade you make. It should contain:
- The entry price, the stop-loss and the take profit
- The amount of balance invested in this trade
- The potential risk and reward (the R:R ratio)
- The state of the market before and after the close
- How you felt before and after the trade
- Your degree of conviction
The 5 Questions to Ask Before Sending a Plan
It’s my decision-making cheat code. If you can’t answer all five, you don’t send it:
- What do I want to see to get in? If you don’t know that, you can’t claim to have a profitable methodology.
- On which timeframe? Swing, intraday, scalping?
- What’s the market sentiment?
- Which asset am I watching?
- What’s my bias?
And one control question, the one that separates a strategy from a hunch: can I explain, in a few factual lines, why I took this trade, and why it works if I repeat it regularly? Not a novel — just a few factual points. Beyond saying “I’m looking for an SFP”: in what context does that SFP actually work?
If you’re just starting out, turn these five questions into checkboxes in your daily plan. You can remove the checkboxes once the reflex is second nature.
What, When and Why You Traded
The reason for the trade comes from technical analysis, fundamental analysis, or a combination of the two. After several dozen trades, you’ll be able to check whether your “reasons” for trading are actually profitable — and work out which approach suits you best.
Conviction is what you feel toward the trade. If you enter based on a technical model and that model meets several of your criteria, conviction is “high.” If the setup doesn’t produce clear conclusions, it’s “medium” or “low.”
By logging your conviction, you can count the number of successful trades at each level. This isn’t trivial: back in school, we’ve all been through the situation of being convinced we’d bombed an exam only to ace it. The reverse holds too. Gut feeling alone lies; measured against results, it becomes data.
Concrete example: if you had high conviction on 10 trades and 8 are winners, that’s an 80% win rate on that segment. If your conviction was low on 10 trades and only 2 are winners, the probability drops to 20%. You quickly conclude that it’s only worth trading when conviction is high.
Notes: Anything That Feels Useful
Write down anything you think is necessary, and especially your emotional state at the moment you place the trade. Conviction and emotion are two complementary criteria: one doesn’t excuse you from the other. A detail that seems trivial in the moment becomes telling during a monthly review.
Log Your Trades Right After the Transaction
Get into the habit of writing down the details right after the trade, while it’s still fresh — and only after placing your stop-loss and take profit. Otherwise, you won’t remember the reasons that pushed you to take it.
This isn’t a mere formality: coming back four days later and genuinely knowing what was going on in your head is almost impossible. After two days, you already barely remember why you made the mistake. Collect the data, analyze it, and take the time to understand why your trades succeeded or failed. After a few months, once you have enough data, you’ll be able to sort it, group it, and put it to serious use.
The Weekly Review: The Real Lever
Keeping the journal daily is good. Reviewing it every week is what turns data into progress. Every Sunday, 20 to 30 minutes:
- What was the costliest pattern of the week?
- What was my best trade, and what made it possible?
- Did I follow my plan every time? Be honest. If not: cut too soon, too late, stop not respected?
- What’s the behavioral goal for next week? Just one.
When everything’s going well, you can skip it. It’s especially when things are going badly that the review becomes vital: as soon as mistakes start piling up, you need a fix before moving forward.
Your Routine: Part-Time or Full Time
You don’t keep the journal the same way depending on how much time you have. And let’s be frank about it: having a job that pays you every month beats an activity where you’re not sure you’ll get paid. Financial stability is what lets you trade properly — when you’re not sure you can put food on the table, you trade badly.
| Time | Part-Time Trader | Full-Time Trader |
|---|---|---|
| Morning | Key closes, macro (DXY, 10-year yields, VIX), economic events. Review key levels. Complete the plan prepared the night before and set alerts. | Same, plus live level tracking. |
| During the day | Execution via limit orders and alerts. An alert goes off → a glance at the chart → there’s a plan or there isn’t. | Less time in front of the charts when the market is calm; intense sessions when it’s volatile. |
| End of day | Review your levels after the briefs, checklist of open positions, log your results, update the watchlist of markets to follow. | Same, plus detailed prep of tomorrow’s scenarios. |
| End of week | Review: results, error analysis, action plan to improve. | |
Two principles hold in both cases. The first: trade in line with your life. You don’t scalp when you don’t have time to scalp, you don’t trade the Asian session when you’re asleep during the Asian session. Part-time, look at the daily and the H4 instead, and avoid short timeframes during the hours you can’t actually get in.
The second: part-time, all of your edge is in the preparation. You don’t have the luxury of trading all day, so the moments you do trade need to be the right ones. That’s exactly the role of the daily plan — and it’s why I do a prep live on Mondays: very often the plan set on Monday doesn’t trigger until Wednesday or Thursday.
Finally, add an activity that calms you down: sports, meditation, whatever you like. Nine years of trading and I still don’t find it any less stressful. You’re playing with money — that’s not nothing.
Other Ways to Keep a Trading Journal
My template isn’t the only path. Here are the four classic formats, with their real limitations — because they all have some.
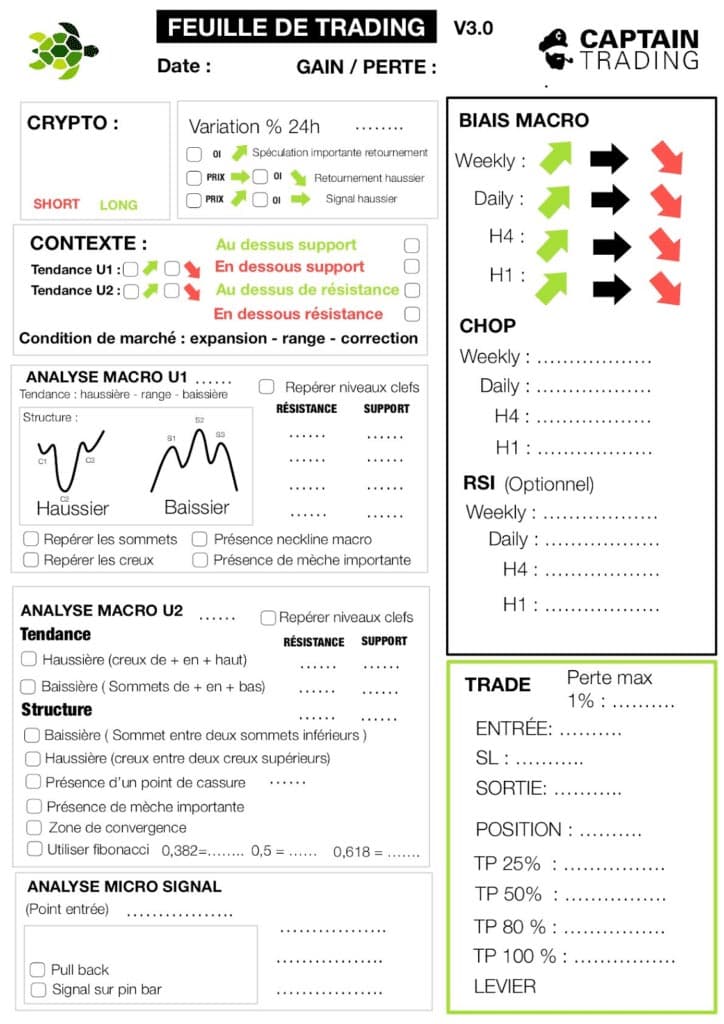
A. The Paper Journal (Trade Sheet)
A notebook or a binder, with sheets prepared in advance. Zero friction, zero technology, and one real benefit: writing by hand slows you down and makes you think.
Who it’s for: beginners starting to structure their approach, and everyone who, like me, keeps a handwritten journal alongside the digital one.
Limits: beyond 50 trades, it’s impossible to analyze a pattern. No automatic calculations.
B. The TradingView Journal
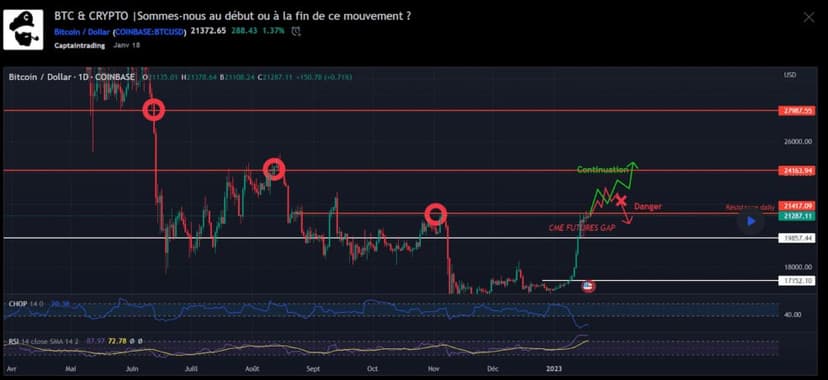
TradingView lets you keep a visual journal for free, right where you do your analysis. That’s its real strength: an annotated chart is worth a thousand lines of spreadsheet.
What you get: about fifty drawing tools, screenshots, live video recording of a trade, public or private sharing, more than 100 indicators, and a grid that keeps your supports, resistances and trendlines from one session to the next without redrawing them.
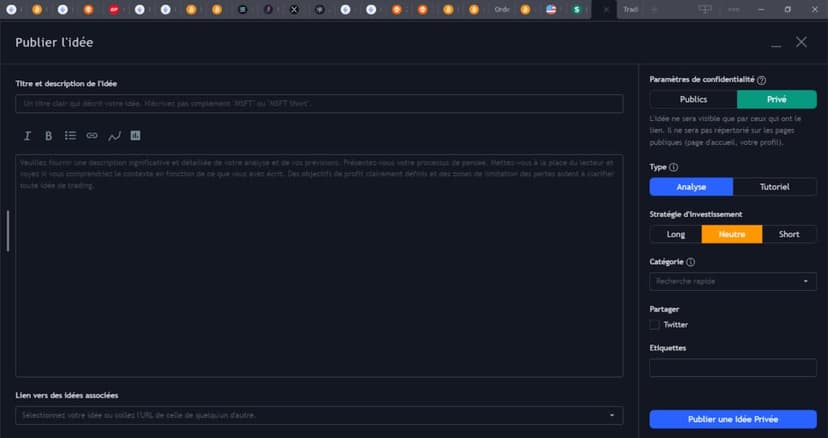
How to set it up, in 5 steps:
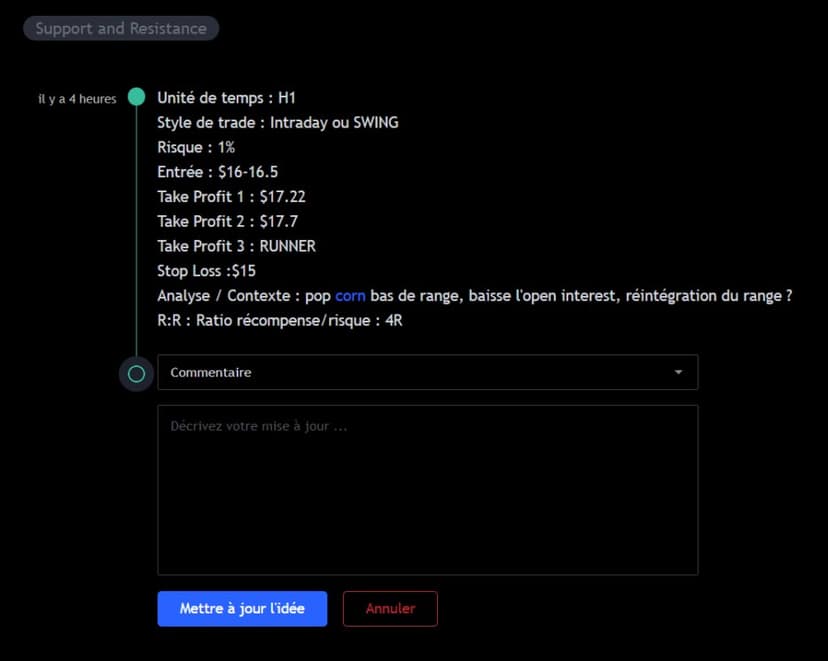
- Annotate your chart before entering a position: timeframe, style (intraday or swing), risk in %, entry, TP 1/2/3, stop, context, R:R ratio. Arrows so you can understand the trade at a glance.
- Publish the idea (blue “Publish” button top right) with a title, your analysis — written so another trader can understand it — and your action plan: how you plan to enter and exit, whether you move your stop to break even, whether you use a trailing stop. Always specify direction: long, short or neutral. Choose “Publish private idea” to keep it for yourself, and add personal tags (swing, range, breakout…).
- Find your journal via the lightbulb icon (“My Ideas”), sorted from most recent to oldest. Give your tags a name that’s your own, otherwise the filter will pull up posts from the entire community.
- Update the entry as the trade progresses. Every update is timestamped automatically: you get the complete timeline of the position. Available statuses: target reached close, stop reached close, active trade, cancelled, closed manually.
- Share — link, image, copy or embed. The link is ideal for posting on Discord and getting feedback.
Limits: TradingView is first and foremost a technical analysis tool. No automated statistics on your overall performance, no behavioral analysis — everything still has to be calculated by hand.
C. The Excel or Google Sheets Trading Journal
It’s the most widespread method, and it’s the one behind my template above. I work on Google Sheets rather than Excel: cloud version, no backup issues, accessible everywhere. Both are free.
If you’re starting from a blank sheet, here are the columns that actually matter:
| Column | Data |
|---|---|
| Date and time | Exact timestamp of the entry |
| Instrument | Pair, stock, crypto |
| Direction | Long or short |
| Entry / SL / TP | The prices of the key levels |
| Risk | The amount actually risked |
| Result | Win or loss |
| R realized | The result as a multiple of risk |
| Strategy | Which setup triggered the entry |
| Conviction | From 1 to 5 |
| Emotional state | From 1 to 10 |
| Notes | Post-trade observations |
Limits: time-consuming to maintain, no automatic detection, and correlating your emotions with your results at scale requires painful formulas.
D. Automatic Journals
A family of tools has emerged in recent years: journals that sync directly with your account (MT5 via a bridge, or an exchange’s API) and that analyze your behavior rather than just your performance. The principle: spotting the abnormally short delay between two trades after a loss, the position size that balloons, the systematic gap between your actual exit and your plan.
They put numbers on three flaws everyone knows about but can’t measure: revenge trading, overtrading, and emotional exits. EdgeDawn is one of these tools.
Is it essential? No. The template above covers the essentials, and the repeat-offender tab does the same job by hand — with the advantage that it’s you writing down the finding, which, as I said, is precisely what makes things change. If you want to try this type of tool, start with their free version: a few analyses are enough to see if the format clicks with you.
Which Trading Journal Should You Choose?
| Your Profile | What I Recommend |
|---|---|
| Complete beginner | Paper or the site’s journal — the most important thing is to start |
| Still learning | My Google Sheets template, daily plan + weekly tabs |
| Active trader on TradingView | Private TradingView ideas for the visuals + the template for the numbers |
| Experienced trader | The 4 template tabs + the site’s journal for the equity curve |
| Prop firm challenge | The complete template, with monthly risk and hard rules written in black and white |
The 3 Truths Your Journal Will Reveal to You
Keeping a journal should be one of the very first steps when you’re learning to trade. It’s what lets you test strategies and find the trading plans that work for you. Three things:
- Your mistakes are repetitive. It’s not bad luck, it’s a pattern — and a pattern can be fixed.
- Your best strategy isn’t the one you think. The data will surprise you.
- Your emotional state weighs far more than you think. Honesty on this point changes everything.
To sum up: a trading journal records your activity, lets you test different plans and different strategies, and identifies the strengths and weaknesses of your style. The guides 12 mistakes to avoid when investing and 5 technical analysis mistakes complement this approach well.
Frequently Asked Questions About the Trading Journal
What Should You Write Down in a Trading Journal?
The bare minimum: the date, the asset, the direction (long or short), the entry price, the stop-loss, the take profit, the amount risked, the result in R, the strategy used, your degree of conviction and your emotional state. All of it rounded out with a free-form note — months later, that note is often what explains the trade. If you had to keep only three columns: the realized R, the mistake made and the why.
Excel, Paper or an App: Which Format Should You Choose?
The one you’ll actually keep up. Paper slows you down and makes you think — ideal for getting started and for the evening review. The spreadsheet (Excel or Google Sheets) remains the standard for statistics. Automatic journals measure your behavior (revenge trading, overtrading), but nothing replaces a finding written in your own hand. My actual practice: a double journal, digital for the numbers, handwritten for perspective.
How Much Time Does It Take Each Day?
Ten minutes in the morning for the daily plan (sentiment, bias, key levels, positions), five minutes after each trade to log it while it’s still fresh, and five minutes in the evening for the confrontation: planned versus actual, one positive, one negative, one fix. On top of that comes the weekly review, 20 to 30 minutes — the only genuinely non-negotiable step.
Is a Journal Useful If I Only Trade Part-Time?
Even more than full time. Part-time, all of your edge is in the preparation: you can’t make up for a mistake mid-session, so the rare moments when you do trade need to be the right ones. The daily plan prepared the night before, alerts at your key levels and the weekly review replace sitting in front of the screen. Plenty of part-time traders actually progress faster: less noise, more method.
Share Your Journal on Discord
Come share your trades in the public Discord. An outside eye often sees what you no longer notice from staring at your own trades, and long-time members will give you the feedback you need.
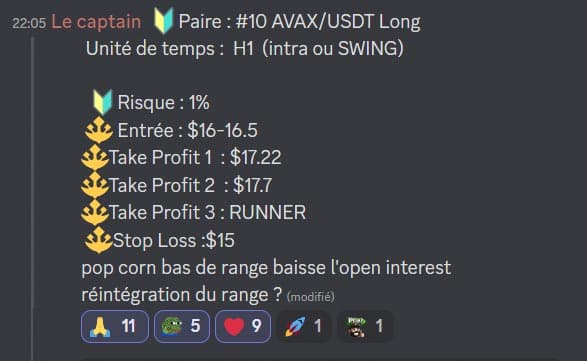
There’s a huge gap between taking your trades in your own corner and sharing them. Crossing that gap is a real milestone: it’s what made me improve the fastest. It’s also why I publish my own plans, live and in full transparency — I then reuse what I said live to trade my week.
All that’s left is to open the template and fill in your first sheet. Do it today, not next Monday: the first day is always the hardest, and it’s the only one that really counts.
Every guide here is free. Browse the full course and join a community of traders who share ideas every day.