What Does RSI Mean?!
The Relative Strength Index | RSI translates into French as Indice de Force Relative. It is a momentum indicator developed by J. Welles Wilder Jr and used in technical analysis. The RSI measures the velocity and the magnitude of an asset’s price movement in order to assess whether it is overbought or oversold. You can track the RSI on most trading platforms, as well as on our technical analysis tools like TradingView.
The Relative Strength Index is displayed as an oscillator (a line chart) on a scale from 0 to 100. That said, the RSI is not limited to identifying overbought and oversold assets.
It can also signal that an asset is likely heading for an imminent reversal of the long-term trend or a corrective price pullback. In doing so, it helps you make sharper decisions when it comes to finding the best moment to buy or sell.
Typically, when the RSI is at or above 70, it points to an overbought condition. As a speculator, this may be the moment to start thinking about selling.
Meanwhile, an RSI at or below 30 signals an oversold condition. As a speculator, it can be worth doing some bargain-hunting on assets whose fundamentals stay solid despite the FUD.
How the Relative Strength Index Works
As a momentum indicator, it compares an asset’s strength on the days when prices rise with its strength on the days when prices fall. Tying the result of that comparison back to price action (PA) lets traders get a clearer read on how an asset is performing.
The RSI, used together with other technical indicators such as moving averages and exponential moving averages | MA and EMA, can help traders make more effective trading decisions. Still, it is important to keep firmly in mind that this indicator always lags behind price, and, as a result: the longer the history used, the more relevant the information it provides.
Calculating the Relative Strength Index
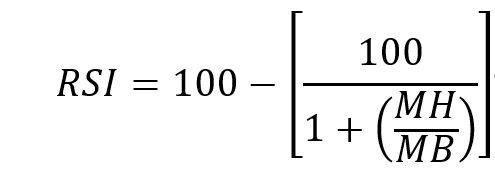
You calculate the Relative Strength Index using the ratio between the average of the gains and the average of the losses over a given period. More precisely, the RSI is worked out with the following formula:
Where: MH is the average of the gains over the last X timeframes (TF).
MB is the average of the losses over the last X timeframes (TF). Please note, however, that you get different results depending on the variables used in the calculation of the RSI. The results vary according to how the averages are calculated (simple, exponential, arithmetic) and which timeframes [monthly (M), weekly (W), daily (D), 4H, etc.)] you choose.
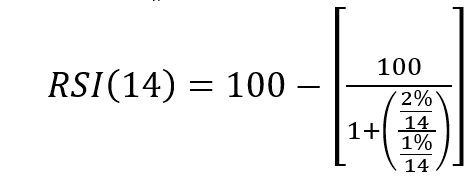
The default length of the period used to calculate the RSI is 14 days. So, if the market closes higher on seven of the last 14 days with an average gain of 2% and the remaining 7 days all closed lower with an average loss of -1%, the RSI is calculated as follows:
RSI: Values and Spotting the Zones
The RSI is an indicator bounded between 0 and 100. It can therefore point to 2 extreme zones and 1 middle zone: the overbought zone, the oversold zone and the neutral zone. The exact midpoint between 0 and 100 is 50, which represents the median value and thus marks the neutral zone. 50 is therefore the central point between the overbought zone and the oversold zone
How to Use, Analyze and Interpret the RSI
Use: Step 1
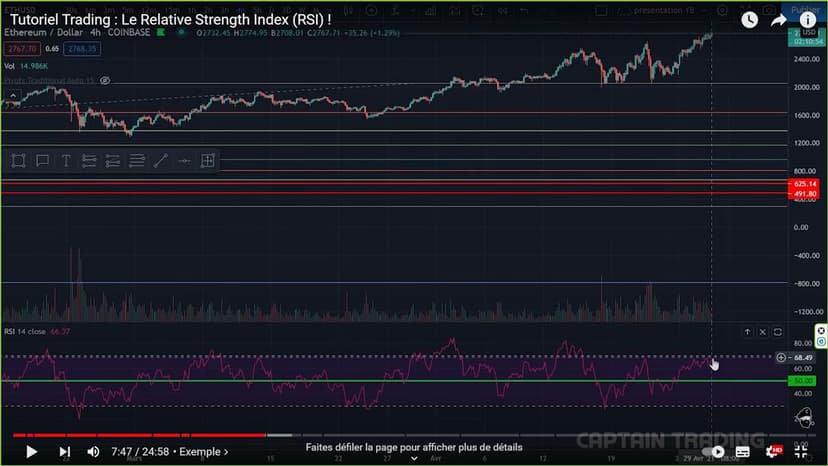
Determine which zone the Price is in | Price Action: overbought, oversold or the neutral zone. To read the Relative Strength Index, I can use plenty of completely free software such as TradingView or Coinalyze.
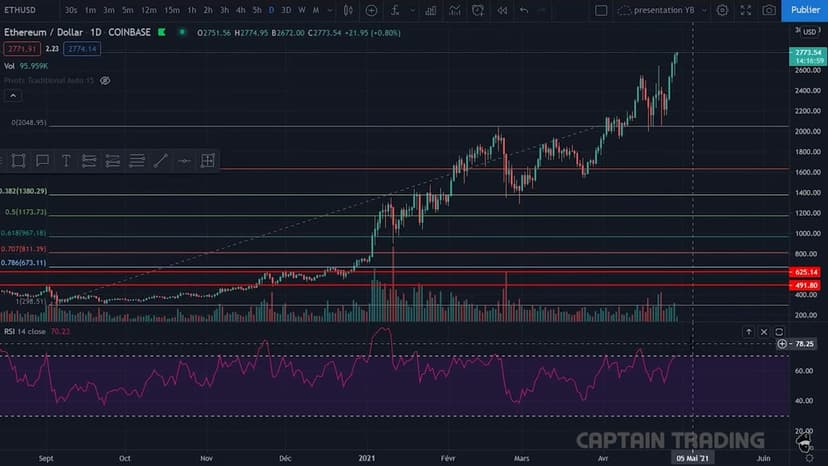
A. Price in the Overbought Zone | above 70
Bullish Trend likely or in sight
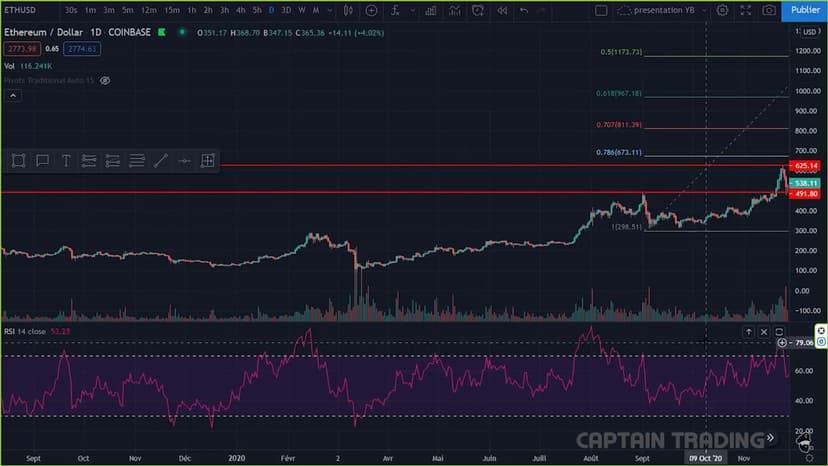
B. Price in the Oversold Zone | below 30
Bearish Trend likely or in sight
C. Price in the Neutral Zone: between 30 and 70
Expect a range
RSI Use: Step 2
Do the opposite of what the RSI suggests in the extreme zones (when confirmed by price action (PA) and other signals):
- Sell in the overbought zone
- Buy in the oversold zone
Careful! This is not a perfect signal — FAR FROM IT! Price can keep climbing for a shorter or longer stretch while in the overbought zone.
Exactly why an RSI signal should be traded with a stop and a calibrated size — never on a hunch. On MT4/MT5, Trade Assistant turns that stop into an exact position size before the order goes out.
RSI Use: Step 3
Trade in the neutral zone; beginner traders too often fixate on the extreme zones without taking the neutral zone into account.
Bullish price action: bullish PA
- A signal to open a long when the RSI crosses the median upward and manages to hold above it, if it is confirmed by the PA.
- A take-profit signal for an open short (confirmation required).
Bearish price action: bearish PA
- A signal to open a short when the RSI crosses the median downward and manages to hold below it.
- A take-profit signal for an open long
In practice, you set up the RSI indicator on TradingView by drawing a line to represent the median, exactly on the 50 level of the y-axis.
The signals given by the neutral zone are far less reliable than those given by the extreme zones. RSI signals should always converge with other signals.
RSI Use: Step 4
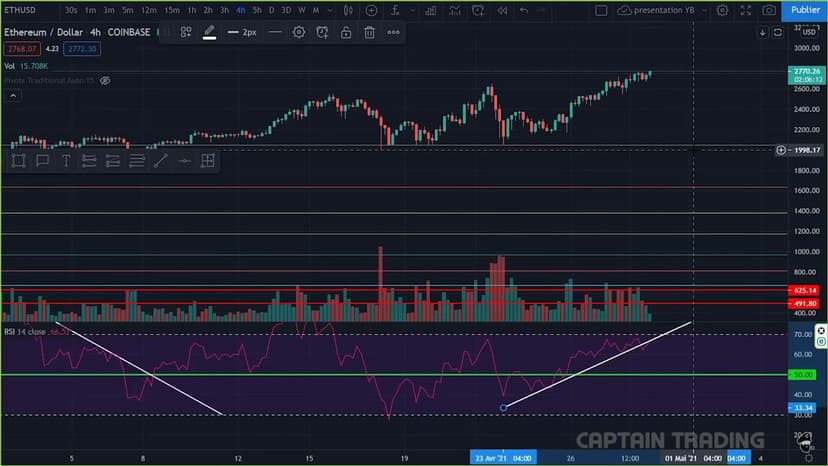
Run technical analysis on the RSI itself; if you can draw a rising trendline on the RSI, it is potentially a sell signal.
RSI Use: Step 5
Divergence: a mismatch between price action (PA) and what the indicator (RSI) is supposed to show. It occurs when the oscillator gives a counter-trend signal relative to the one that price action (PA) usually shows. By watching for divergences, you can therefore spot anomalies.
Divergences can give “clues” about the strength or weakness of the current trend. They are anomalies: they let us spot reversals ahead of time.
These divergences are the keys to understanding and using the RSI effectively.
RSI: the 2 main categories of divergence
Using divergences in your interpretation and technical analysis lets you spot reversals or potential moves. Here we will look at the different types of bullish and bearish Relative Strength Index divergences
1. So-Called Classic or Obvious RSI Divergences
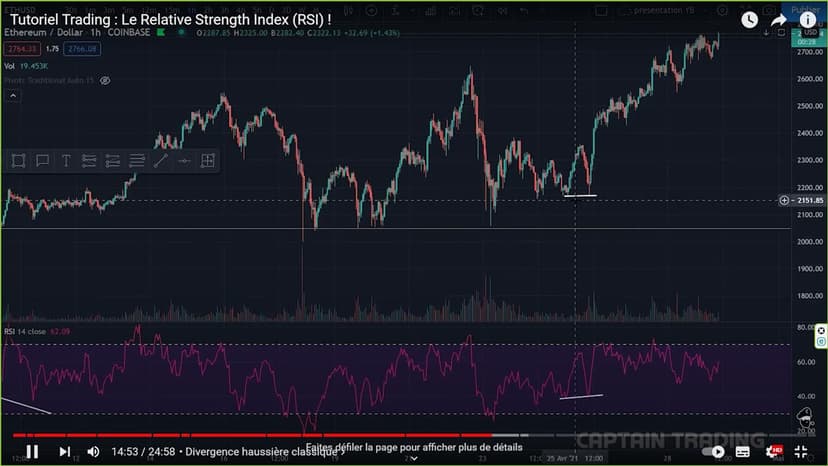
a. Classic Bullish Divergences
- Price prints increasingly lower lows, or equal ones
- The indicator prints increasingly higher lows, or equal ones
b. Classic Bearish Divergences.
It is quite simply the reverse:
- Price prints increasingly higher lows, or equal ones
- The indicator prints increasingly lower lows, or equal ones
2. Hidden Divergences
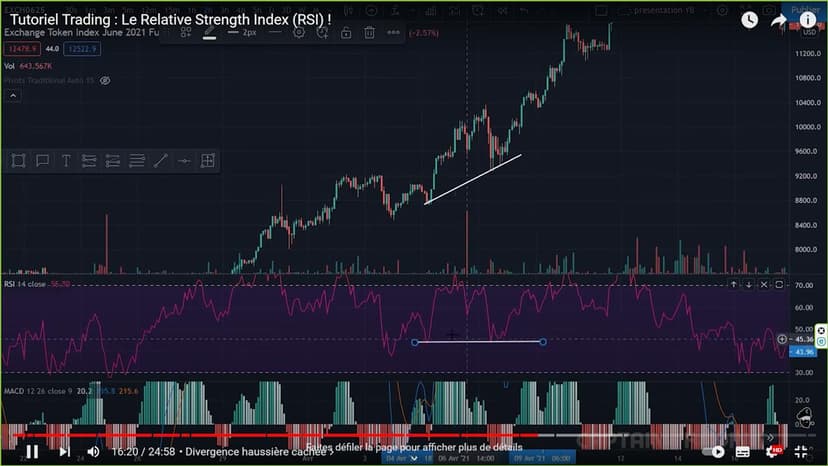
a. Hidden Bullish Divergences
- Price prints increasingly higher lows, or equal ones
- The indicator prints increasingly higher highs, or equal ones
b. Hidden Bearish Divergences
- Price prints increasingly lower highs, or equal ones.
- The indicator prints increasingly higher highs, or equal ones
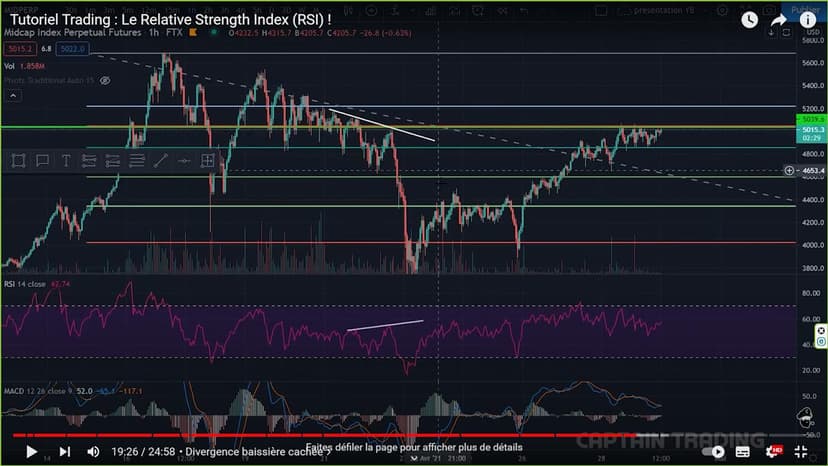
My YouTube Course on the Relative Strength Index
Relative Strength Index and Swing Failure Patterns
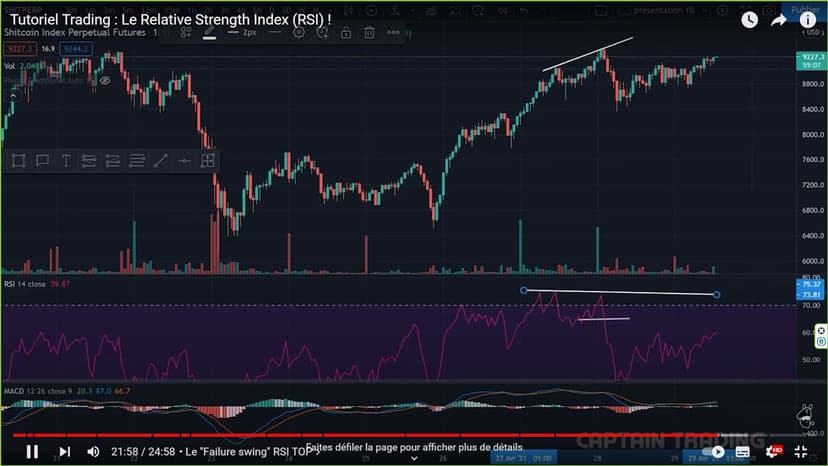
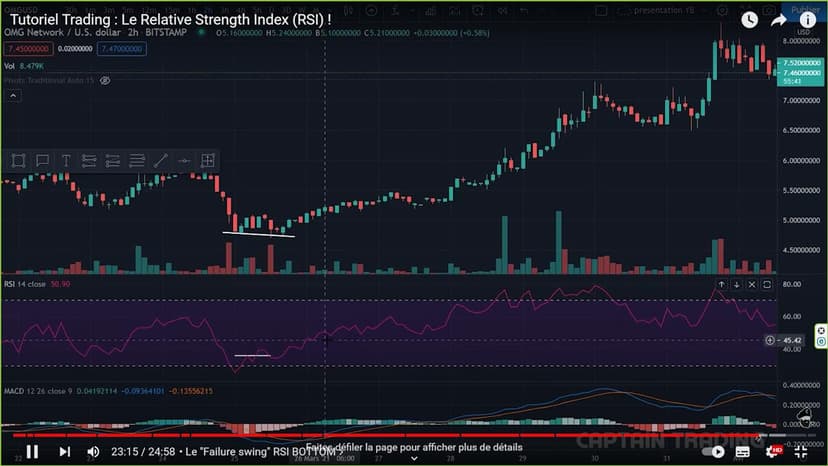
Swing Fail Pattern definition: It is a failure to break past the most recent high or low when the RSI sits at extreme values.
Swing Failure Patterns: The 2 Types
The Swing Fail Stop
The Swing Fail Bottom
To learn more about the trading patterns I actually use, know that I have also put together a course dedicated to this very topic!
If all of this speaks to you, I strongly recommend moving straight on to my free YouTube course and my hands-on RSI tutorial! Otherwise, I recommend wandering through our trading and crypto blog for more free courses on technical indicators!
Every guide here is free. Browse the full course and join a community of traders who share ideas every day.