In my opinion, TradingView is an essential tool for crypto traders. Its optimal user experience and its advanced technical analysis tools let you work in excellent conditions. The charts and technical analysis tools are customizable and compatible with many crypto platforms.
This multi-market platform lets you diversify your portfolio without constraints. Among the features on offer, you get: real-time news, backtesting, the social network, courses, and more.
TradingView helps traders save time thanks to cutting-edge analysis tools that have been around for many years already! In my view, it’s a must-have, and this isn’t an expense to quibble over. And by the way, don’t hesitate to tell me in the comments if you’ve found an interesting alternative.
In this guide, we’ll cover everything you need to start using the features I find most useful on TradingView!
TradingView and AI: The Official MCP
New in September 2026: TradingView has launched its own MCP server, in public beta. It connects Claude, ChatGPT or Codex to your TradingView account — your watchlists, your alerts, the screener, prices, news and the economic calendar — with nothing to install: paste an address into your AI, grant one authorization, and you’re good to go.
Step-by-step setup, the list of the 35 tools, the beta’s limits, security and ready-to-use prompts: it’s all covered in our guide to the TradingView MCP.
TradingView: 3 New Features
When you’re the No. 1 player in an industry, it’s common to see progress stall. Usually, new developments are kept on ice until the competition starts closing in. What do you think — is that why TradingView recently rolled out new features?!
It’s entirely possible when you see newcomers like Exocharts showing up and bringing serious firepower…
That said, I’m only here to spark your curiosity, sharpen your critical thinking, and give you the chance to learn new things so you can perform on the financial markets.
So here’s my latest tutorial, walking you through 3 new features developed by TV!

TradingView: Creating an Account
The first step is to create an account on the platform. This gives you access to all of the platform’s functions and tools. You can sign up for free or opt for a paid subscription that unlocks additional features.
With my affiliate link, you get a €30 credit offered by TV. I’ve never really understood what I get out of it, but if it can save you a little something, go for it!
On top of that, everyone is entitled to a 30-day free trial — don’t hesitate to take advantage of it as soon as you’re ready!
You can access the platform on any device — smartphones, tablets, computers — no matter the operating system.

Here are the steps to follow in detail:
- Click “Get started” at the top right of the home page to begin the sign-up process.
- Ideally, use a personal email address by clicking “Email” to create an account. It’s important that the address you provide is working so that TV can validate your account.
Security tip: if you can create a separate, dedicated email address for every site that holds your confidential data, do it! It’s a hassle, but so reassuring, because you compartmentalize the risk.
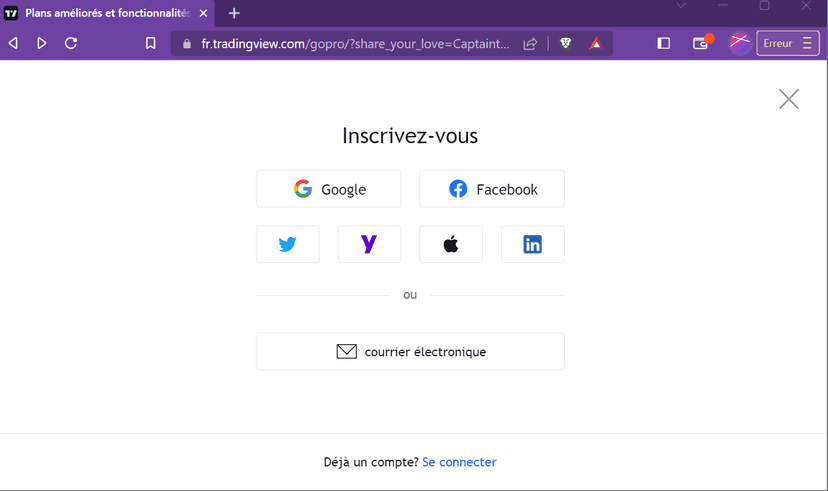
- Set your password: You’ll need to choose a password for your TradingView account. Obviously, we recommend using a strong password. Then store it safely in open-source software that encrypts your passwords.
Security tip: store your logins and passwords in KeePass, for example. You can also use an old phone that’s cut off from the internet, with no Wi-Fi and no SIM card. Then use an InputStick to bridge it with your PC
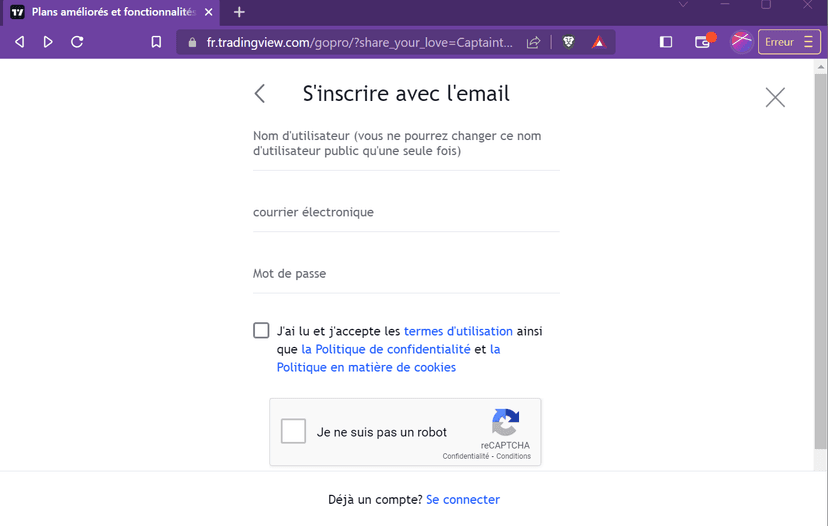
- Choose your status: there’s a good chance it will be non-professional.
- Click sign up: Once you’ve filled in all the information, you can click the “Sign up” button. You’ll receive a confirmation email containing an activation link for your account.
- Activate your account
- Log in
- Explore TradingView’s features : real-time charts, technical indicators, technical analysis tools, and more
Finally, if you want to enjoy TradingView’s advanced features, you can opt for a paid Pro or Premium subscription.
This costs between €15 and €60/month depending on whether you go for Pro, Pro+ or Premium, and you get a 30-day free trial.
It gives you access to additional features such as real-time alerts and advanced technical analysis. Best of all, you’ll be able to trade directly through TV!
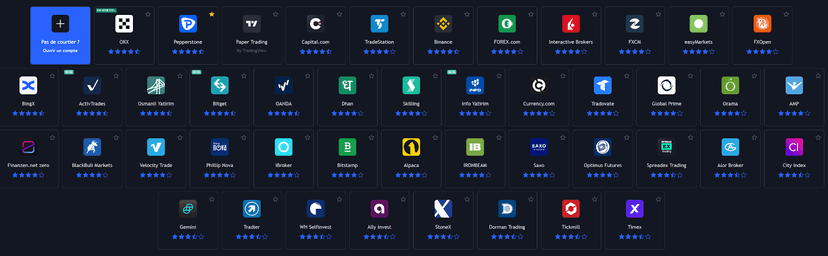
TradingView’s Features
Once you’ve created an account, explore the platform and get familiar with its various features. You can access interactive charts, technical indicators, fundamental analysis tools, news, and trading ideas.
This step is essential to get used to the platform’s various features:
- interactive charts that let you analyze market trends,
- technical indicators to help you spot buy or sell signals,
- fundamental analysis tools to assess the fundamentals of the financial markets,
- news to keep track of the economic and political events that can impact the markets,
- trading ideas and plans to help you build your own trading strategy.
- the various features for executing orders and managing your positions.
You also get access to a wealth of important information:
- trading conditions
- spreads
- commissions,
- as well as security and risk management tools.
Take your time with TradingView, because understanding everything the platform can do can dramatically optimize the way you trade.
TradingView: Trading Style and Interface
The tool adapts to every trading style: scalping, intraday, swing. Choose your preferred chart layout. Also set the indicators you want to use, along with any settings you find useful, to save time when reading your charts!
It’s important to customize your trading platform to match your personal preferences. That can include customizing the user interface, choosing the colors, arranging the screen layout, and deciding how information is displayed. By customizing your trading platform, you can access the features you use most quickly and easily, and create a trading environment that best suits your own needs.
Tailor the platform to how you use it!
This includes setting up your own technical indicators, your trading dashboard, your price alerts, and your watchlists to track the markets you care about most. By customizing your trading platform to suit your personal style, you can not only improve your trading experience but also boost your performance as a trader.
Personally, I’ve actively used this valuable feature. In fact, I’ve customized several TV tools, notably the famous “Fibonacci Retracement”.
All in all, taking the time to explore and customize your trading platform is an important step. It lets you tailor it to your own trading style. And it will help you get the most out of TV.
The Economic Calendar
TradingView’s economic calendar is a valuable tool for traders and investors. It lets you keep track of the major upcoming economic announcements and events that can move the financial markets.
This tool provides detailed information on economic events such as employment figures, interest rates, central bank announcements, retail sales, corporate earnings, and much more. TradingView’s economic calendar displays the dates, times, and forecasts for each event, along with the actual results and how far they deviate from expectations.
Traders can use this information to make informed investment decisions. For example, if an economic announcement comes in better than expected, it could push up the stock market for a given company or sector. On the other hand, if an announcement is worse than expected, it can drag down the related financial markets.
All in all, TradingView’s economic calendar is a handy, practical monitoring tool for investors who want to make informed investment decisions.
Create Watchlists on TradingView
One of these features is the ability to create watchlists to track the various markets in real time.
Here’s how to create a watchlist on TradingView:
- Log in to your account and click the “Watchlist” icon in the bottom-right corner of the screen.
- Click the “Add symbol” icon to open a search window.
- Search for the market you want to track using the symbol or the name of the financial asset.
- Once you’ve found the market you want to add, click the “Add to watchlist” button.
- Repeat steps 2 to 4 to add other markets to your watchlist. You can also create sub-lists to organize your markets into themes or categories.
- Click the “Add sub-list” icon to get started.
Also very handy: you can export and import watchlists in TV.
To remove a market from your watchlist, click the “Delete” icon next to the symbol.
Your watchlist is now created. From there, you can follow the markets in real time using TradingView’s charts and tools.
Creating an Automatic Alert with TradingView
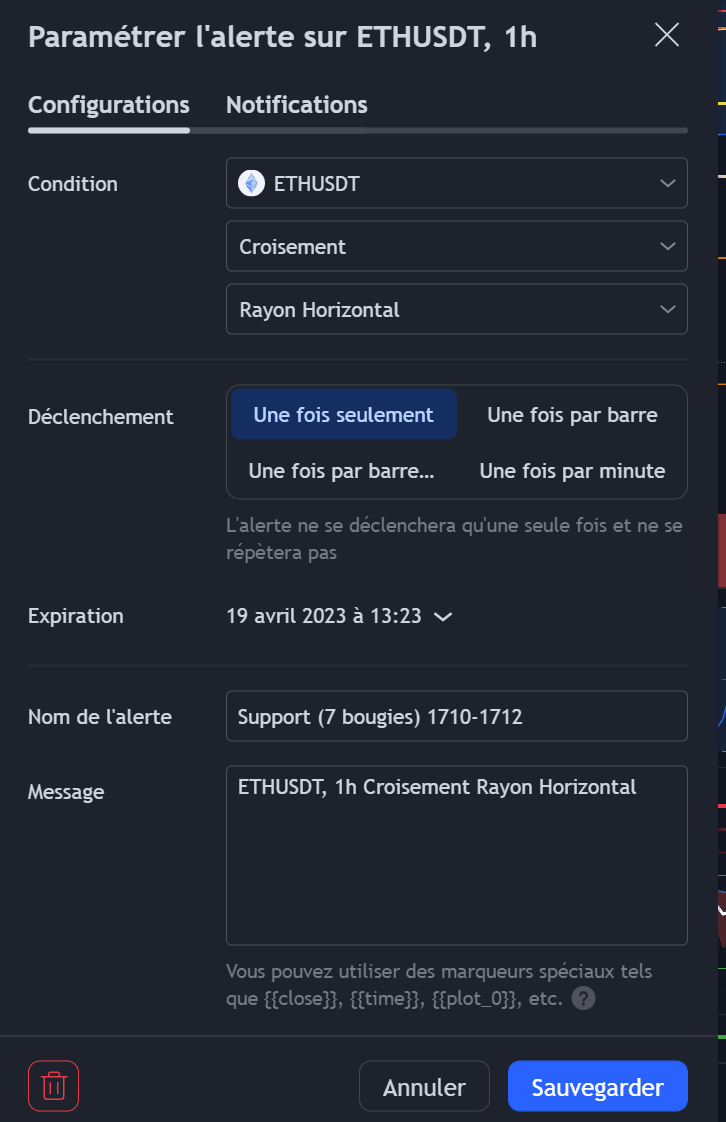
Automatic alerts are a valuable tool for any trader. When I’m not in front of the screen, they’re what let me know every time prices reach key levels. You can set up alerts for prices, technical indicators, and economic events.
Creating alerts on TradingView can help you track the price movements of the assets you’ve selected. Here’s how to create alerts:
- Open the chart of the asset you want to create an alert for.
- Click the alert icon at the top of the chart, or use the keyboard shortcut CTRL + A
- Select what you want to be alerted on. It can be a specific price, a trend, an indicator, or even an economic event.
- Configure the alert settings. You can choose the price level, the alert type, the alert’s expiration, and how you want to receive the alert.
- Finally, click “Create” to save your alert.
Once the key levels are reached, you’ll receive an alert by email, mobile notification, or a pop-up directly on the TradingView platform. This lets you react quickly to market conditions in line with your trading strategies.
Use TradingView’s Technical Indicators
Indicators help traders identify trends and overbought or oversold zones. TradingView offers a very wide range of indicators, including the ones I use as well as hundreds I don’t even know about.
Here are a few indicators designed to make reading price easier
- Moving Averages
- Bollinger Bands
- Ichimoku
- RSI | Relative Strength Index
- MACD
- Chop Index: my little favorite, as you already know!
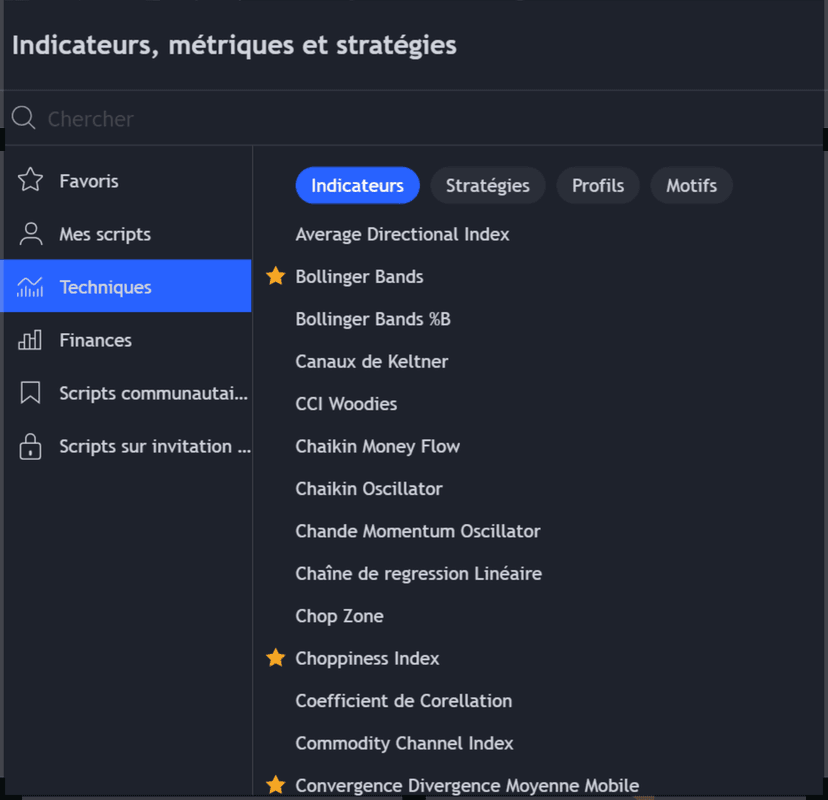
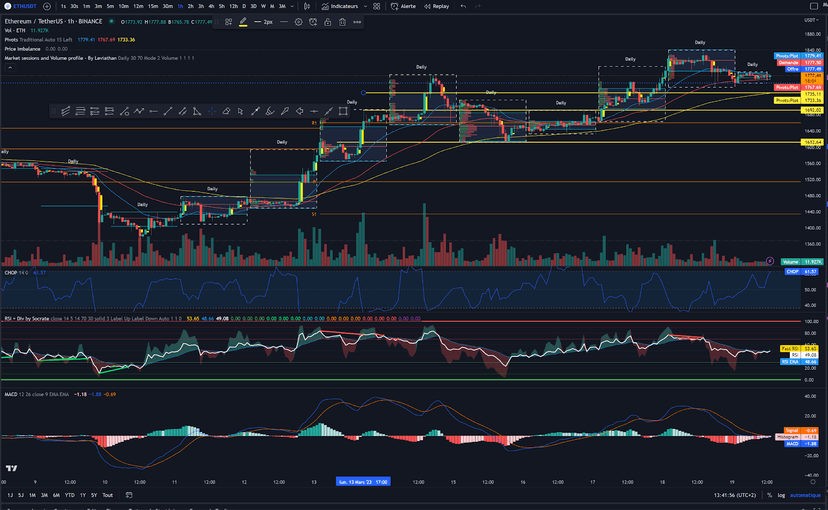
A few indicators designed to make reading price easier
Moving Averages
These are tools that smooth out price fluctuations to help traders visualize the overall market trend.
Bollinger Bands
This is a chart indicator that plots two lines around the moving average, representing the overbought and oversold zones.
RSI (Relative Strength Index)
This is an indicator I use every day. It measures a market’s strength and weakness by comparing the number of days the price rose with the number of days it fell. The RSI is a popular tool for identifying overbought and oversold zones, using a level of 70 to signal overbought conditions and a level of 30 to signal oversold conditions.
MACD (Moving Average Convergence Divergence)
Here’s another popular indicator that uses moving averages to measure the strength and direction of a trend. The MACD is used to identify trend reversal points and moving average crossovers.
Ichimoku
It’s a technical indicator for analyzing the trend. Ichimoku also lets you interpret its strength and define support and resistance levels. It’s made up of five lines, the best known of which is the Kumo, or cloud.
The Chop, or Chop Index
As you probably already know, the Chop is one of my favorite indicators. It’s used in market analysis to measure how prone the markets are to volatility. It’s based on calculating the difference between the maximum range and the minimum range over a given period.
Reading the Chop: the higher the Choppiness Index, the more volatile the markets, and vice versa.
Bollinger Bands
They are an indicator used to assess the volatility of a financial market. They are formed by three lines. A central line represents the moving average over a given period. The 2 upper and lower bands sit a certain number of standard deviations away from the moving average.
Price movements that pull away from the central line toward the outer bands can indicate that the market is overbought or oversold.
In particular, traders can use Bollinger Bands to identify entry and exit points for specific positions.
It’s worth remembering that Bollinger Bands should not, on their own, be the sole basis for a trading decision. The same goes for any technical indicator.
TradingView and Price Action: My Routine
Every morning, I follow an unchanging routine. My method is to always work from the general to the specific — from the big-picture view of the market down to a more detailed one.
Price Action analysis on the cryptos I have in my sights is part of my routine! It consists of analyzing how a financial asset’s price behaves on the markets.
The idea is to analyze the PA by moving from higher timeframes down to smaller ones: 4H, 1H, 15m, 5m.
TradingView makes switching perspective very quick and easy. The comfort that comes from it is priceless, in my view.
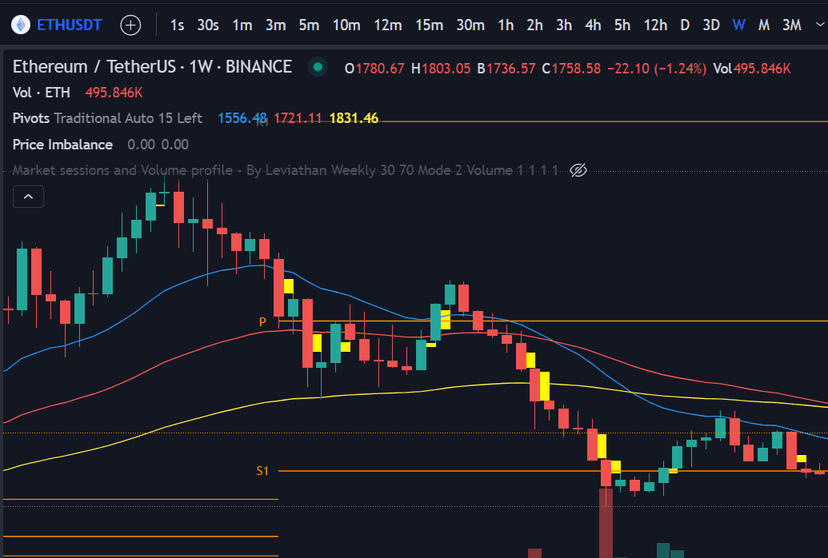
In the example above, each candle represents one week (Weekly) and covers the ETH / USDT pair.
I reinforce my analysis by using my favorite indicators available on TV: the Chop Index, Open Interest, and the RSI.
The point of TV is to get a complete view of the situation.
on the market and to make more informed, more precise trading decisions thanks to a confluence of signals.
An Example of Reading Price
A high Chop Index and Open Interest + an RSI below 30 can indicate that the asset is oversold. From there, it’s likely to move back up, offering an attractive buying opportunity.
The News with TradingView
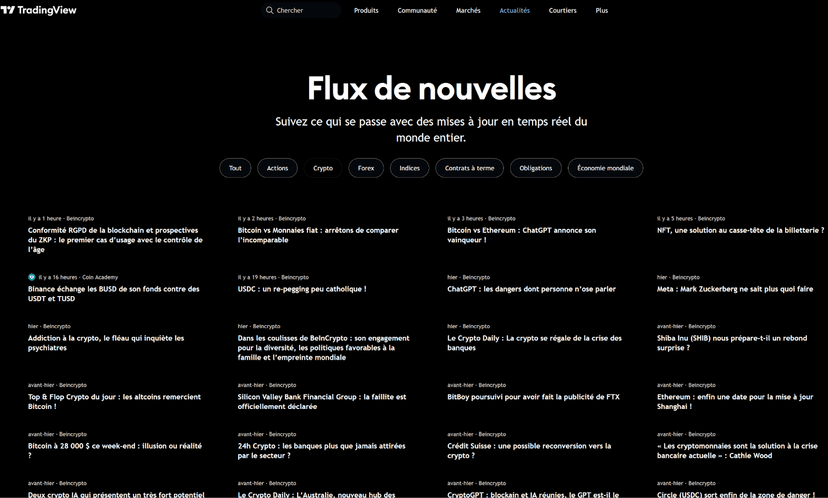
Crypto and financial market news can have a significant impact on the financial markets.
Use TradingView’s “News” tab to keep up with the latest economic and financial news.
Analyzing the news is an important part of trading decision-making, even if you know my fondness for Price Action. The impact of the news is often crucial, because major economic events have an immediate effect on the markets.
It’s essential to follow the events and news relevant to the market you’re investing in. This can help you make informed decisions and avoid potentially costly investment mistakes.
Here you get an ultra-comprehensive news feed!
TradingView: Finding Trading Signals
TradingView offers a unique feature called “Trading Ideas” via the “Ideas” tab in the main menu. Users can submit their trading ideas and share them with the community. You can also browse trading ideas for inspiration.
Users can put forward their trading ideas, explain their reasoning, and add charts and indicators to back up their analysis. Other community members can then view these ideas, comment on them, and like them, which builds genuine collaboration between traders.
By browsing trading ideas, users can also find new leads to explore. The search filters let you sort ideas by instrument, expiry, market type, and many other criteria. You can also follow the traders whose ideas you like and get notifications when new ideas are published.
Ultimately, TradingView’s “Trading Ideas” feature is a valuable tool for traders, because it lets you share knowledge, discover new opportunities, and build an active, engaged community.
Join the TV Community
TradingView is a social platform, which means you can interact with other traders. You can follow other traders, comment on their trading ideas, and exchange ideas with them. It’s a meeting place for traders of every experience level.
The platform also lets you create groups, or join existing ones, to collaborate with traders who share similar interests.
What makes this platform unique? It lets you see other traders’ strategies through their own charts and technical analyses.
By collaborating with other traders, you can also gain different perspectives on the market and on assets you might not have considered before. You can also share your knowledge and ideas with other traders, which can help you develop a deeper understanding of the market and make better trading decisions.
All in all, collaborating with other traders can be a truly rewarding experience for traders of every experience level. It can help you improve your trading skills, develop innovative trading strategies, and broaden your trading horizons.
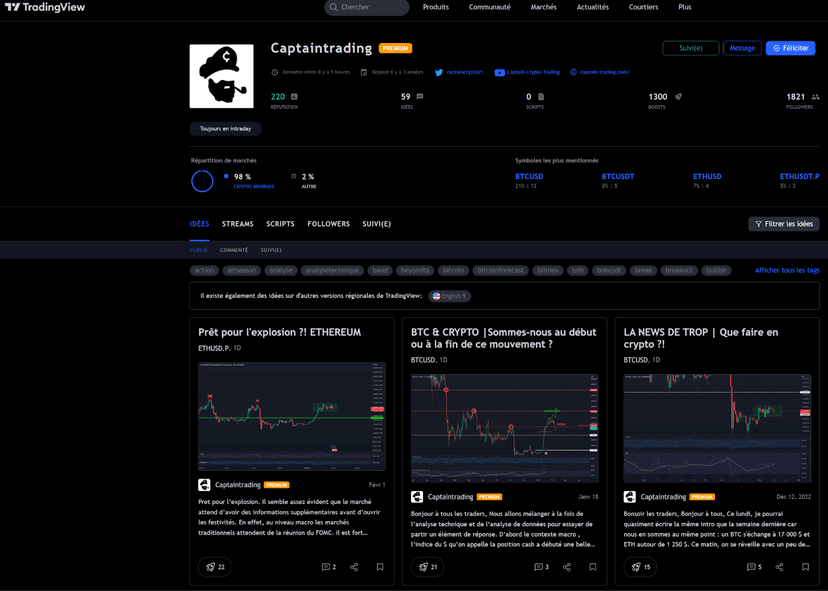
By the way, feel free to follow me on TradingView :
TradingView: The Screener
The screener is a powerful tool that lets you search for stocks, cryptocurrencies, and currencies based on your criteria. You can use the screener to find trading opportunities.
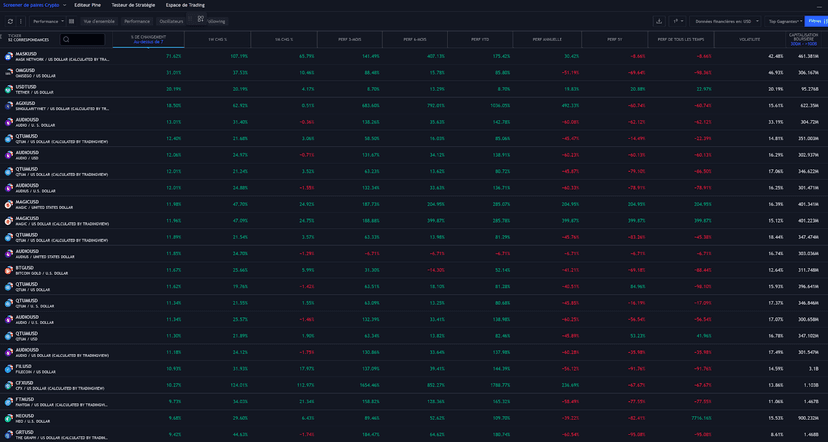
It lets you filter financial assets according to specific criteria, such as market capitalization, trading volume, past performance, and much more.
This feature can be used to identify attractive trading opportunities based on each user’s individual preferences.
For example, a trader looking for undervalued stocks with a market cap of under $1 billion can use the screener to filter only the stocks that meet those criteria. This saves you time and reduces the risk of trading assets that don’t match your preferences. The screener is a useful feature for any trader looking to find potential trading opportunities quickly and efficiently.
Paper Trading: Practice on TV!
If you’re new to trading, use the paper trading (simulated trading) feature on TradingView to practice. This will let you get familiar with the platform and test different strategies without risking real money.
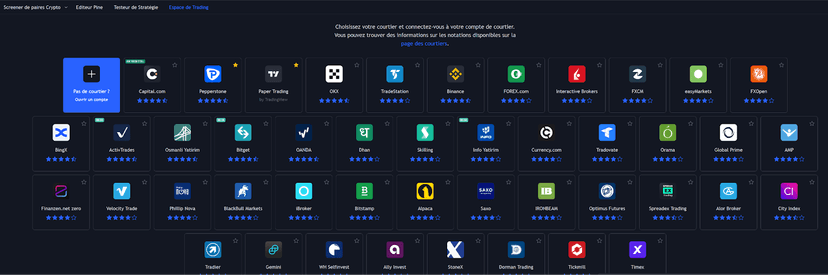
When you’re starting out in trading, it can be hard to know where to begin. One of the best ways to get familiar with the mechanics of trading is to first try it out with a demo or simulated account.
TV’s “simulated trading” feature lets you test different trading strategies, understand how the platform works, and get to know the various features on offer. That way, you can learn to buy and sell assets, follow price charts, and use the various technical analyses and indicators available.
Once you’ve practiced enough in “paper trading” mode, you can start trading with real money knowing you already have some experience under your belt.
On that note, I’ve written an entire tutorial to teach you how to trade for free. I encourage you to refer to it to get familiar with trading before you dive into the real thing.
This approach will help you feel safer in your trading and manage the risks tied to potential losses. Remember that it’s essential never to invest money you can’t afford to lose.
Building Your Trading Journal
TradingView is an excellent tool for creating and keeping a trading journal. Here are a few steps to use it for that purpose:
- Create a TradingView account if you don’t already have one.
- Under the “Chart” tab, select the financial instrument you want to track.
- Add indicators or drawings to your chart to identify points of interest.
- Write your trading ideas, hypotheses, and plans in the annotations or notes on the chart.
- Track your trade as it develops in real time by updating the annotations as you go.
- Use the publish feature to share your trades with other users or to keep a public record of your trades.
It’s important to keep a trading journal to measure your performance and better understand your mistakes and your wins. By using TradingView as a trading journal, you can easily visualize your trades and analyze them to improve your strategies.
Here again, I’ve written an entire tutorial on the importance of keeping a trading journal. It explains in detail how to use TradingView as a trading journal.
Pinescript: TradingView’s Programming Language
Developing Your Own Technical Indicators and Trading Strategies
Pinescript is a programming language designed specifically for traders on the TradingView platform. It lets you code custom indicators and trading strategies that can be used to analyze the financial markets in real time and make your decisions automatically. It’s clearly a more technically accessible alternative to trading bots.
This language offers great flexibility, letting you tailor your indicators and trading strategies to your own trading style.
You can even build indicators from scratch using real-time market data. You can incorporate data such as prices and volumes, blending them with other technical indicators, for example. The goal, of course, is to define automated buy and sell signals.
You can test and backtest your strategies to assess their potential performance based on historical data.
In summary, Pinescript gives traders great flexibility to code custom indicators and trading strategies tailored to their trading style on the TradingView platform.
To go further, I encourage you to check out the Pinescript user manual.
TradingView: Replay Mode
This is a feature that lets you replay market data from a past period in order to uncover new trading opportunities or sharpen your technical analysis skills.
To access Replay mode, select the chart you want to work on. Then click the “Replay” icon at the top of the screen. Next, choose the time range you want to replay, then adjust the playback speed and the time interval between each candle.
Once you’ve launched Replay mode, you can watch the market’s movements in real time. Then you can make trading decisions using the available technical indicators and analysis tools. You can, for instance, view the charts across several timeframes and observe the various support and resistance levels to better understand market trends.
Replay mode also lets us test our trading strategies in real time using historical market data. This means we can see how our strategy would have performed in a real market context without having to risk real money.
To test a strategy in Replay mode, select a financial instrument and a time range over which you want to test your strategy. TradingView will then load the historical market data for that period.
You can then use the play and pause feature to simulate different market conditions and assess how effective your strategy is in real time. You can also use custom indicators and scripts to test specific trading ideas.
It’s important to note that Replay mode does not guarantee results identical to live trades. Real-time market conditions can be very different from historical data. On top of that, economic factors can also have a major impact on the markets. Still, Replay mode is useful for testing a strategy realistically before making real decisions.
Replay mode is a powerful tool that will let you “ trade for free ” by testing your strategies through a review of historical data. You can also test different hypotheses in real time. This feature is genuinely great!
TradingView: My Verdict
TradingView is a truly powerful platform. It’s ideal both for beginner traders and for very experienced ones.
Like thousands of pro traders, I use it every day to analyze Price Action. TV helps me take my trades faster and be more efficient and more precise. On top of that, it gives me all the data I need almost in real time.
Every trading tool and indicator we need is on TV. You can even customize them and create your own!
TV is also a fantastic communication tool. TradingView even lets you keep a trading journal or build a trading bot.
TradingView is a complete and almost indispensable tool; it will help you reach your goals — there’s no denying it!
Every guide here is free. Browse the full course and join a community of traders who share ideas every day.