Key takeaways:
- The COT report (Commitments of Traders) is published every week by the CFTC, the U.S. regulator of the futures markets: it shows how the main categories of market participants are positioned in futures contracts.
- Positions are recorded as of Tuesday and usually published on Friday at 3:30 PM New York time, which is 9:30 PM in Paris most weeks.
- There are four reports: Legacy, Disaggregated, Traders in Financial Futures (TFF) and Supplemental. The oldest, the Legacy report, sets the commercials, who hedge, against the non-commercials, who are mostly speculators.
- The column to check first is Change, the week-over-week change: it’s what helps you define a bias, while the volumes show how much force is behind it.
- The COT is a big-picture tool with a weekly rhythm: it helps you set a bias, not pick the exact moment to enter.
- To read it for free and without an account, we’ve built our own COT hub (in French for now): 43 markets laid out every week, a few minutes after the CFTC releases its data.
The Commitments of Traders reports — or COT reports — are produced to help the public understand market dynamics. If you got started trading the traditional markets with Fusion Markets, a Prop Firm or even MetaTrader, this is a topic you need to master!
Not sure how a Prop Firm actually works? My Prop Firm guide explains the challenges, the funding, and the rules you need to know.
The “COT reports” provide a breakdown of Open Interest every Tuesday for futures and options on futures markets in which 20 or more traders hold positions equal to or above the reporting levels set by the Commodity Futures Trading Commission, or CFTC.
By the way, the CFTC publishes its weekly COT reports as raw tables, designed for industry professionals. To read them faster, we’ve built our own COT hub at Captain Trading, free and with no account required: the CFTC’s figures are laid out there for 43 markets, every week, a few minutes after they’re released. The interface is in French for now, so we walk you through it, screenshots included, further down this guide.
Every historical report can be viewed with the data for the week in question, along with all the historical data compressed into an annual file.
What Are COT (Commitments of Traders) Reports?
The COT reports are based on position data supplied by the reporting firms (FCMs, clearing members, foreign brokers and exchanges). Although the position data is supplied by the reporting firms, the actual category or classification of the traders is based on the predominant commercial purpose the traders declare on the CFTC’s Form 40, and is subject to review by CFTC staff to verify that it is well-founded.
The reports are not intended to state the specific reasons for traders’ positions and, as a result, that information plays no part in determining traders’ classifications.
In practice, this means, for example, that the position data for a trader classified in the “producer/merchant/processor/user” category for a given commodity will include all of their positions on that commodity, whether the position is held for hedging purposes – or for speculation.
It’s worth noting that traders can declare their commercial purpose on a per-product basis, and so may hold different classifications in the COT reports for different underlying commodities. In fact, for one of these reports — titled “Traders in Financial Futures” — traders are classified in the same category across all commodities.
Owing to legal constraints, the information on how independent traders and other retail traders are classified in the COT reports is not made public.
In general, the COT reports describe positions as of Tuesday and are released on Friday. The CFTC receives the data from the reporting firms on Wednesday morning, then corrects and verifies it before releasing it on Friday afternoon, at 3:30 PM New York time. All the 2026–2027 release dates, with the corresponding Paris time, are listed in our COT release calendar.
What CFTC Stands For

The U.S. CFTC, or Commodity Futures Trading Commission, is an independent agency of the United States federal government. It is responsible for regulating the futures markets and the options markets. Here’s an overview of its role and functions
It plays a crucial role in overseeing the derivatives markets, which are essential for risk management across many sectors of the economy. These markets allow farmers, producers, businesses and investors to protect themselves against fluctuations in commodity prices and interest rates.
In short, the U.S. CFTC is a key institution in the United States financial system, providing regulation and oversight of the derivatives markets to protect investors, maintain market integrity and promote financial stability. It is this organization that publishes the COT reports.
Commitment of Traders: The 4 Types of COT Report
Legacy Reports
This report is the oldest and the most important one to watch — well, almost… It splits traders into two broad categories: the “Commercials” (commercial traders) and the “Non-Commercials” (non-commercial traders).
According to BBS, our traditional-markets specialist, you should watch the non-commercials’ reports first and foremost, because these are the big institutional players that “steer” the market.
To be more precise, also note that THE column to watch is the Change column, which shows the delta — that is, the change from the previous week. Volumes still matter, of course, because they give you a sense of the force behind the moves. That said, it’s the changes that will help you define your bias.
On our COT hub, this change is the “Δ sem.” column of the dashboard (sem. is short for semaine, French for “week”), and every market page repeats it in its tiles (example: the euro page). The non-commercials are called “grands spéculateurs” there, meaning large speculators. The COT Index rounds out the picture: it shows where a group’s net position sits within its one-year range, from 0 (its low) to 100 (its high).
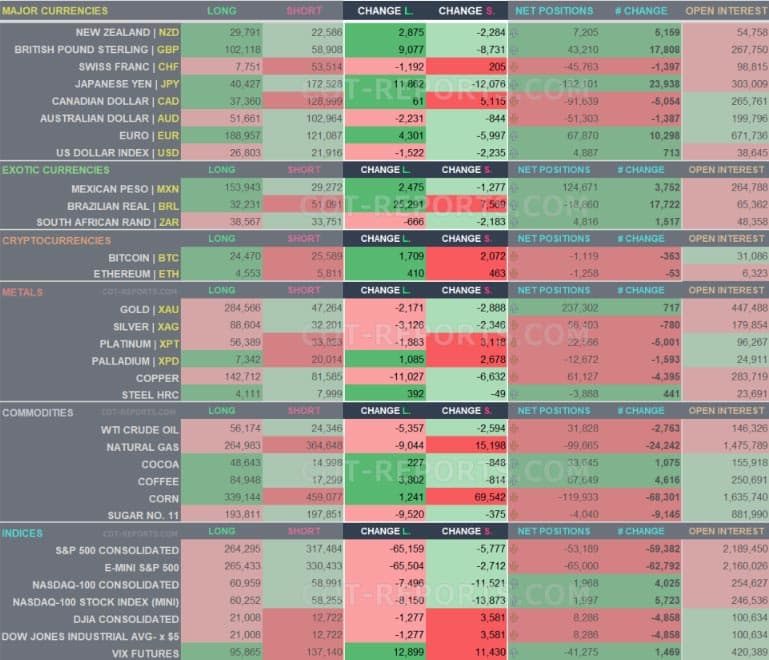
Take currencies, for instance: what becomes interesting is spotting the large changes in one currency relative to another in order to anticipate a bias.
For example, if you see the following situation: USD: +20K contracts and EUR: –20,000 contracts
There’s bound to be something interesting to do there!
If both show +20,000, then there’s no point looking at the pair.
Specific relevance: Commercial traders are generally market participants that use futures to hedge their actual business activities. Think of farmers and commodity distributors, for example.
The so-called non-commercial traders, on the other hand, are mainly speculators.
This report is especially useful for understanding price movements driven by speculation as opposed to commercial hedging.
What to watch: Keep an eye on the net positions of commercial and non-commercial traders.
For example, if the non-commercials’ net positions become extremely long while the commercials are extremely short, that could point to a coming correction, since the commercials are often seen as the best-informed.
Example using crude oil: Suppose the non-commercials have built up long positions at record levels while, at the same time, the commercials are increasing their short positions. This can signal that oil prices are about to fall. The reason is that the commercials’ top priority is to hedge; they habitually hedge to protect the value they have created or hold!
To compare like with like: what would your priority be if you held 100 BTC in spot?!
Keep speculating, or protect your assets?!
Personally, I’d hedge every single day if I held that much BTC; I’d keep a “big” account for hedging and a “small” account for trading. Who knows… maybe that’s already what I do
Disaggregated Reports
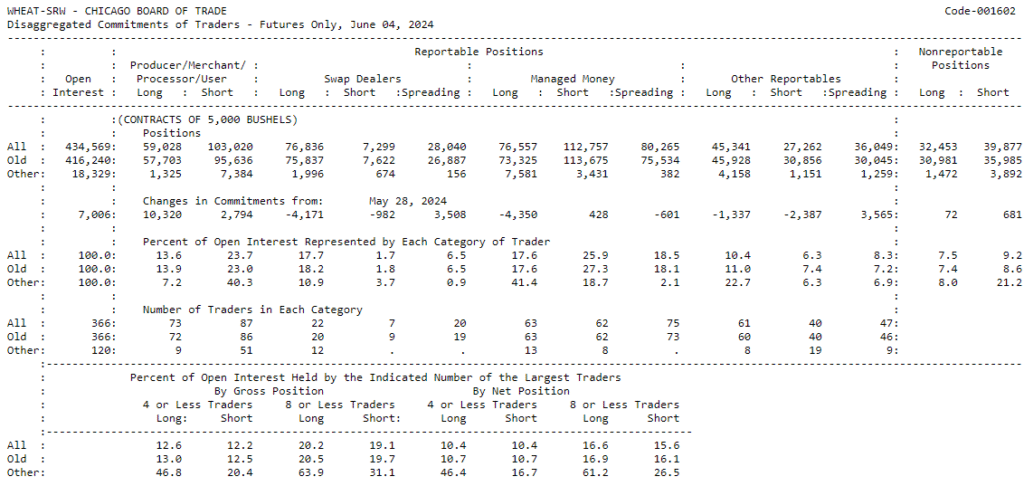
Introduced in 2009, this report offers a more detailed view by dividing positions into four categories: “Producer/Merchant/Processor/User”, “Swap Dealers”, “Managed Money”, and “Other Reportables”.
This report helps you better understand the different roles of the market participants and their potential impact on prices.
For example, managed money is often made up of hedge funds, whereas the “Swap Dealers” are financial institutions that use swaps.
What to watch: Examine the managed money positions.
A sharp increase in long or short positions in this category can indicate a shift in market sentiment.
Example interpretation using the wheat market: If managed money sharply increases its long positions, that could indicate an expectation of rising wheat prices based on market analysis, weather forecasts or other fundamental factors.
Traders in Financial Futures (TFF) Reports
This report focuses on the financial futures markets, such as currencies, interest rates and stock indices.
It divides positions into four categories:
- Dealer / Intermediary
- Asset Manager / Institutional
- Leverage Funds
- Other reportables
This report is especially useful for analyzing traders’ positions in the financial markets, offering a perspective on the strategies and expectations of the various participants, notably asset managers and other speculative funds (leveraged funds).
What to watch: Keep an eye on the “Asset Manager/Institutional” positions (asset managers/institutionals). These traders represent large institutional funds, and their moves can have a significant impact on the markets.
Example interpretation using the U.S. Treasury bond market: If the “Asset Manager/Institutional” category increases its Short positions, that could indicate an expectation of rising interest rates and a fall in bond prices.
Supplemental Reports
This report is a supplemental version of the Legacy report for certain specific markets, offering additional information and a more detailed breakdown of positions.
Used mainly for markets where greater transparency is needed, this report helps provide more precise insights into the dynamics of certain specific markets.
What to watch: Use these reports to get additional detail on specific markets where greater transparency is needed. Look for significant divergences between the trader categories for precise insights.
Example interpretation using GOLD: If the supplemental reports show that the “Swap Dealers” are cutting their long positions while the “Managed Money” — the asset managers — are increasing their long positions, this could signal a short-term overvaluation and a possible correction!
And yes — it’s commonly accepted that asset managers aren’t the best operators…
Good to know: on our COT hub, the dashboard compares the 43 markets using the Legacy report, the only classification common to all of them. Each market page then adds the detailed classification that fits it: TFF for financial markets (currencies, interest rates, indices, crypto), disaggregated for commodities, such as wheat or gold.
Passionate about the traditional financial markets?!
1. Our Marchés Tradis session every Wednesday evening on YouTube at 8 PM!

To make sure you don’t miss this live stream or any other, I’d encourage you to turn on notifications directly, because simply following is no longer always enough to be alerted!
And if we’re running live streams right now, it’s so the information stays fresh and usable by as many people as possible!
2. The free Captain Trading space: COT reports, lives and replays
Join the free Captain Trading space: with a simple account, you get the daily plan in your trading journal, decoded COT reports, lives and their replays, and the community help room built right into your dashboard — you ask your question in your language and we answer in your language! It’s all free. If you’d like to support us, open an account with one of our partner platforms through the Cashback page: 5% of your trading fees are yours for good, and 10 to 20% in the months when your volume justifies it — that’s what allows us to keep going.
The Premium subscription is paid, but I offer you several ways to get it free for 1 to 3 months if you place a trade on OKX or trade 2 lots on Blueberry after depositing $500.
In both cases it’s worth your while, because there’s no minimum deposit on OKX and you get a welcome bonus on your first deposit.
On Blueberry, meanwhile, you can get back 50% of your deposit as a bonus, up to $5,000 — which is really worth it, because it can add up to $2,500 in bonus, a nice little windfall to reduce your risk!
For all the details, head to the VIP Group!
Short Format VS Long Format
The reports are available in a short format and a long format. The short report shows open interest separately for reportable and non-reportable positions. For reportable positions, additional data is provided for commercial and non-commercial holdings, the split, the changes from the previous report, the percentages of open interest by category, and the number of traders.
The long report, in addition to the information contained in the short report, also groups the data by crop year where applicable, and shows the concentration of positions held by the four and eight largest traders. The supplemental report is published for combined futures and options on certain agricultural markets and, in addition to all the information contained in the short report, it shows the positions of index traders.
COT Report: The History, for the Enthusiasts!
The history of the Commitments of Traders (COT) reports goes back to 1924. That year, the U.S. Department of Agriculture’s Grain Futures Administration (predecessor of the U.S. Department of Agriculture’s Commodity Exchange Authority, itself the predecessor of the CFTC) published its first comprehensive annual report on hedging and speculative activity in the regulated futures markets.
Starting June 30, 1962, the COT data was published on a monthly basis. At the time, this report — covering 13 agricultural products — was presented as “a major step toward the transparency of financial operations vis-à-vis the public.” The goal was to provide current, fundamental data on futures-market activity to all market participants. These original reports were then compiled at the end of the month and published on the 11th or 12th day of the following month.
Over the years, the CFTC has improved the Commitments of Traders reports in several ways as part of its ongoing efforts to better inform the public about the futures markets.
The COT report is published more frequently: mid-month and end-of-month in 1990, every two weeks in 1992, and on a weekly basis from 2000 onward.
C.O.T Report: Faster!
The COT report shifts up a gear and speeds up its releases: the sixth business day after the “as of” date in 1990, then the third business day after 1992.
C.O.T Report: More Information
The report contains more information: data on the number of traders in each category, a breakdown by crop year and concentration ratios were added in the early 1970s; options position data in 1995; and a supplemental report in 2007 showing the positions of index traders in certain agricultural markets.
The report is also more widely available: it went from a subscription mailing list to paid electronic access in 1993 and, from 1995 onward, the reports became free on the CFTC.gov website!
Current and historical Commitments of Traders data is available on CFTC.gov, as is the historical COT data going back to 1986 for the futures-only reports, to 1995 for the combined options-and-futures reports, and to 2006 for the supplemental report.
Where Can You Read the COT Reports?
cftc.gov: The Official Source
As you already know, it’s the CFTC that publishes the Commitments of Traders reports, on its official website: cftc.gov. Everything is there, free of charge, archives included, but as plain-text tables, one market at a time. It’s the reference to keep at hand whenever in doubt. Here’s what a report looks like:
The disaggregated report for SRW wheat as published by the CFTC (positions as of June 4, 2024): complete, but raw.
Captain Trading’s COT Hub: Our Free, Easy-to-Read Version
Reading these tables takes some practice. That’s why we built our COT hub, in the Data & Marchés section of the site: the CFTC’s official figures, laid out for 43 markets (crypto, indices, currencies, U.S. interest rates, energy, metals and agricultural products). The data is frozen once a week and goes live a few minutes after the CFTC’s release. It’s free and requires no account.
One important point: the tool is still in beta and is designed for learning. It describes past positions, gives no advice and doesn’t say what the price will do. The interface is in French for now, so here’s how to read it step by step, with each label translated along the way.
1. The Entry Page and the Next Release
At the top of every page, a banner announces the CFTC’s next release, with a countdown and the steps of the week: positions recorded on Tuesday, brokers’ reports on Wednesday, the CFTC’s checks on Thursday, release on Friday. The left-hand rail (a tab bar at the bottom of the screen on mobile) leads to the tool’s tabs: “Tableau de bord” (dashboard), “Fiche actif” (market page), “Comparer” (compare), “Heatmap”, “Rapport hebdo” (weekly report), “Multi-semaines” (multi-week), “Guide & méthode” (guide & method) and “Données” (data). Finally, a setting lets you choose the level of the texts: “Débutant” (beginner), in plain sentences, or “Pro”, more detailed.
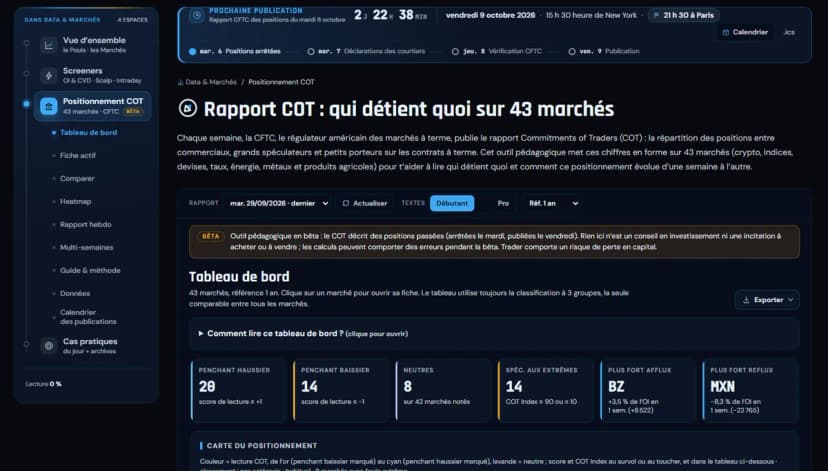
The entrance to the COT hub: the next release, the tabs and the Débutant / Pro settings (French interface; example: the September 29, 2026 report).
2. The Dashboard: Net Position, Weekly Change and COT Index
The dashboard sums up the 43 markets. The positioning map sorts them by category, with one dot per market, colored according to that week’s COT reading. “Haussier” (bullish) and “baissier” (bearish) describe how participants are positioned, not a price forecast: the dots range from gold (a marked bearish lean) to cyan (a marked bullish lean), with lavender for neutral markets. Below the map, the table reads column by column:
- Net spéc. (speculators’ net): the net position of the large speculators (the Legacy report’s non-commercials), in contracts and as a percentage of open interest. Positive means they’re net long; negative, net short.
- Δ sem. (weekly change): the change in that net position over one week. It’s the Change column of the official report, the one BBS looks at first.
- COT idx spéc. and COT idx comm.: the COT Index of the large speculators and that of the commercials, from 0 (net position at the low of the lookback period, one year by default) to 100 (at the high). The commercials’ index is usually read in a contrarian way.
- Petits porteurs (small traders) and OI 4 sem. (4-week open interest): the share of small traders’ positions that are long, then the change in open interest over four weeks.
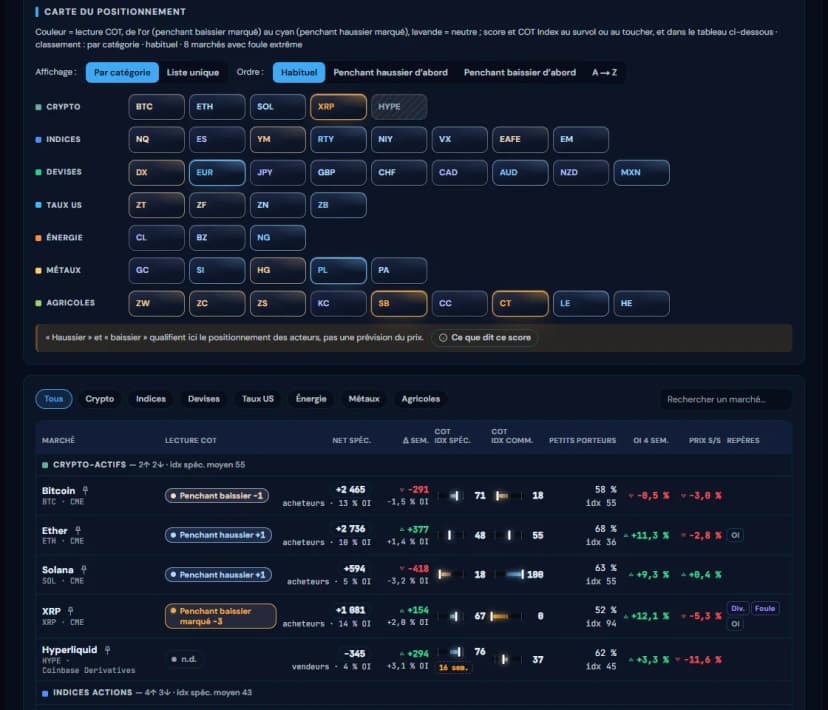
The dashboard: the positioning map, then the market-by-market table (French interface; example: the September 29, 2026 report).
3. The Heatmap and the Week’s Extremes
The Heatmap tab shows the COT Index of all 43 markets at a glance, for the group of participants you choose (large speculators by default) and over the window you choose: 52 weeks, 3 years or 5 years. The principle is simple: 0 is the lowest net position in the window, 100 the highest. So a market at 95 is not “95% long”: its large speculators have almost never been this long, or this lightly short, over the period. Markets in the upper zone (90 and above) or the lower zone (10 and below) are flagged.
At the top of the tab, the “Extrêmes de la semaine” block (the week’s extremes) does the sorting for you: markets at a 52-week high or low, the biggest move of the week and the markets in the upper or lower zone. It’s a good starting point for applying the Legacy “What to watch” tip from earlier: extreme positioning deserves a closer look, without being a signal on its own.
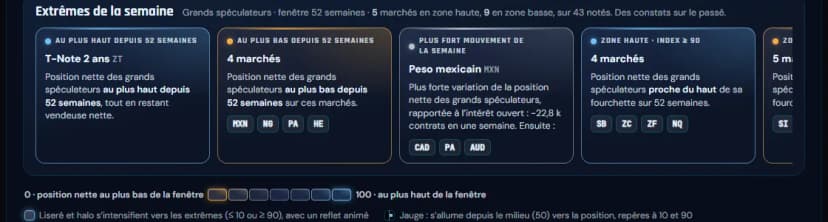
The “Extrêmes de la semaine” (the week’s extremes), the place to look first (French interface; example: the September 29, 2026 report).
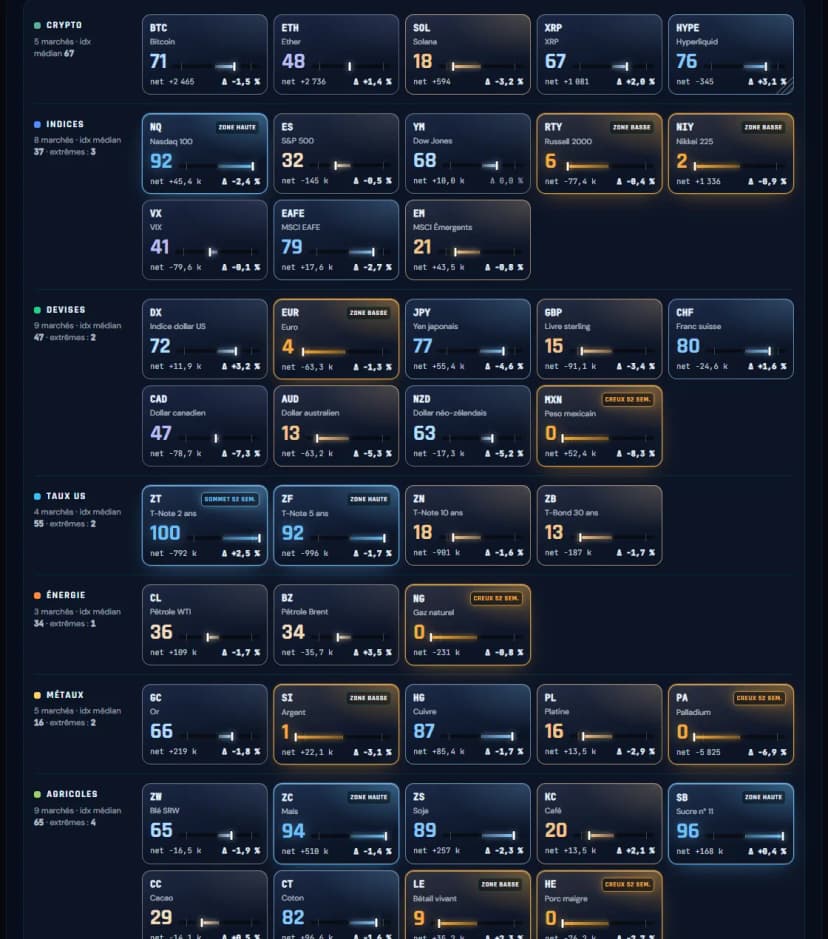
The heatmap of the large speculators’ COT Index over 52 weeks, by market category (French interface; example: the September 29, 2026 report).
4. A Market Page: The Weekly Reading
Each market has its own page: the euro, gold, WTI crude oil, the S&P 500 or the U.S. Dollar Index, for example. At the top, the weekly reading sums up in a few sentences who is buying, who is selling and what has changed. A learning score from −4 to +4 then translates it into a “penchant haussier” (bullish lean) or a “penchant baissier” (bearish lean), more or less marked. Here again, this lean describes how participants are positioned, not where the price will go next.
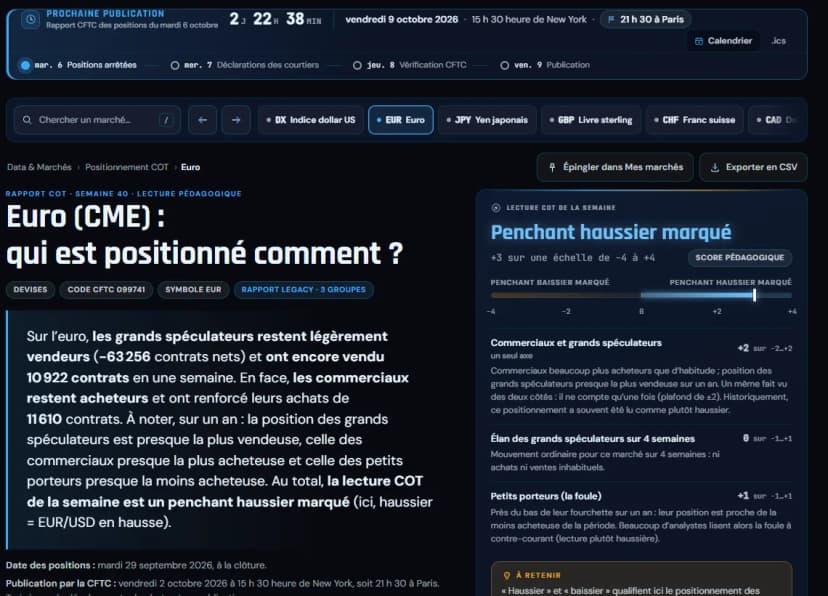
The euro page and its weekly reading (French interface; example: the September 29, 2026 report).
Further down, four tiles present the participants with their official CFTC names: the large speculators (Non-Commercial), the commercials (Commercial), the small traders (Non-Reportable, positions too small to be reported) and open interest. Each participant tile gives its net position, its one-week change and its one-year COT Index. In the euro example, the large speculators were net short (−63,256 contracts), near the bottom of their one-year range, while the commercials were net long (+40,577), near the top of theirs: the mirror image of the scenario in the Legacy “What to watch” tip. That’s the positioning the tool read that week as a marked bullish lean.
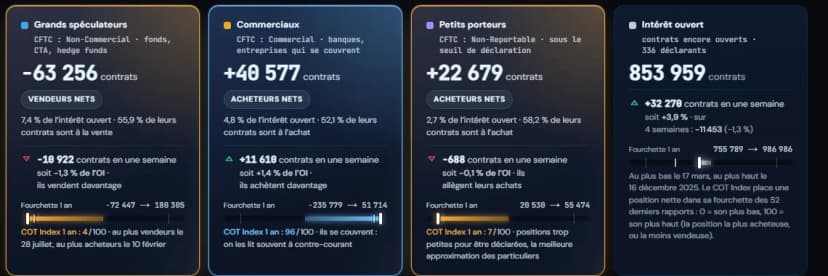
The three groups of participants and open interest on the euro page (French interface; example: the September 29, 2026 report).
Next, the chart plots the net positions of the three groups over 52 weeks, with the price as a dotted line for reference: this is where you see whether the week’s change extends a move that has lasted several months or breaks away from it. The page ends with the detailed positions (the Legacy report, then the TFF or disaggregated classification depending on the market), an FAQ and related markets.
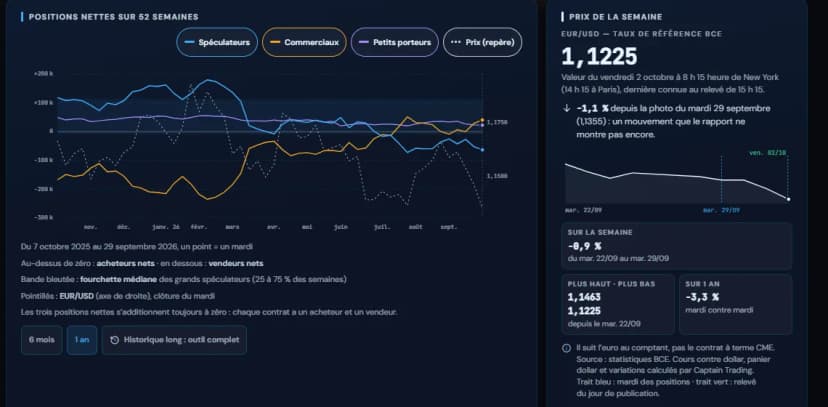
Net positions over 52 weeks and the week’s price (French interface; example: the September 29, 2026 report).
5. The Release Calendar and Its .ics File
One last useful habit: the COT release calendar lists every 2026–2027 date, with the Paris time already worked out for each one, and flags the weeks when a U.S. public holiday shifts the release. One button adds these dates to your calendar app (an .ics file, with a reminder 15 minutes before), another lets you subscribe so the calendar updates itself. And if you always follow the same markets, pin them in “Mes marchés” (my markets): the list is kept in your browser, no account needed. As for the “Données” (data) tab, it exports the figures as CSV for your own analysis.
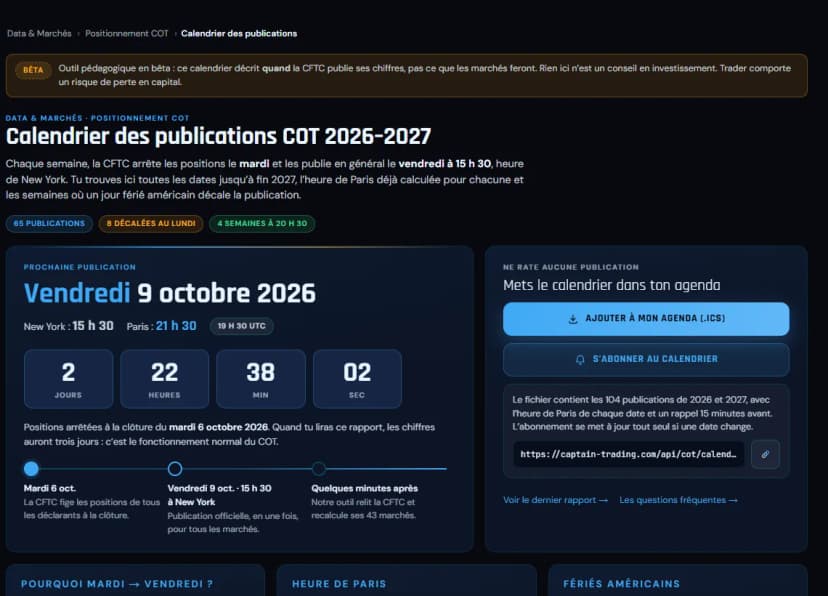
The release calendar and its .ics file (French interface; screenshot taken on October 6, 2026, before the October 9 release).
Also keep in mind that the COT remains a big-picture tool: it helps you set a bias, which you then refine with technical analysis to choose when to enter.
Finally, if you want to learn more about the BBS method, I can only recommend his Marchés Tradis NV1 and NV2 courses!
They’ll let you get started in the traditional financial markets with a solid grounding and a turnkey strategy!

Frequently Asked Questions
Where Can You Read the COT Report for Free?
The official figures are published for free by the CFTC on cftc.gov, as raw tables. For an easier read, Captain Trading’s COT hub lays out the same data for 43 markets every week, free of charge and with no account needed: a dashboard, a COT Index heatmap, a page for each market and the release calendar. Its interface is in French for now, and this guide translates the main labels for you.
When Is the COT Report Published?
The CFTC records positions as of Tuesday’s close and usually publishes the report on Friday at 3:30 PM New York time, which is 9:30 PM in Paris most weeks. A U.S. public holiday can shift the release: all the 2026–2027 dates are in our COT release calendar, which you can add to your calendar app in one click.
Which Column of the COT Report Should You Check First?
The week-over-week change, in other words the Change column of the official report: it’s what helps you define a bias, while the volumes say more about the strength of the move. On our COT hub, it’s the “Δ sem.” (weekly change) column of the dashboard. The COT Index rounds out the picture by placing the net position within its range, from 0 (at its lowest) to 100 (at its highest).
What’s the Difference Between Commercials and Large Speculators?
Commercials (the CFTC’s “Commercial” category) use futures to hedge a real business activity: producers, commodity distributors, banks or companies protecting themselves against price swings. Large speculators (“Non-Commercial”), the non-commercials of the Legacy report, are mostly funds taking a position on the market’s direction. Small traders (“Non-Reportable”) cover the positions that are too small to be reported.
Do You Need an Account, and Does the COT Hub Give Advice?
No and no. The COT hub is free and can be used without an account, including to pin your markets or export the data as CSV. It’s a learning tool, still in beta: it describes past positions. “Haussier” (bullish) and “baissier” (bearish) describe how participants are positioned, never a price forecast, and nothing on it constitutes investment advice. Trading involves a risk of losing capital.
Every guide here is free. Browse the full course and join a community of traders who share ideas every day.