Introduction to marketmonkeyterminal.com
Market Monkey is a tool built for demanding traders who want to read the markets through the analysis of Order Flow, liquidity structure, and advanced tools like the DOM, the Heatmap, the Volume Profile or even the Market Profile (TPO).
The goal of this guide: to walk you through it step by step so you get the most out of every feature, from setting up the interface all the way to in-depth analysis.
Who is it for? Traders from beginner to advanced — anyone into scalping, day trading, or swing trading.
Getting Started with Market Monkey
Signing up
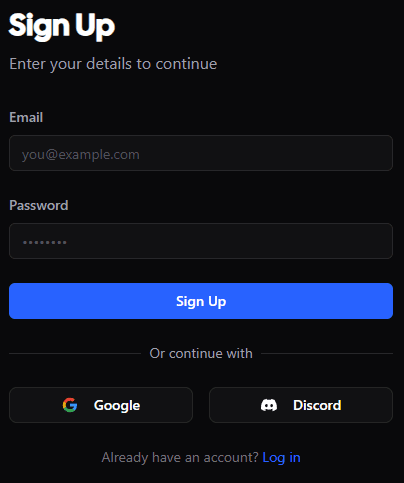
It’s done simply with your email address, but also through a Google or Discord account.
Free or paid version depending on your needs
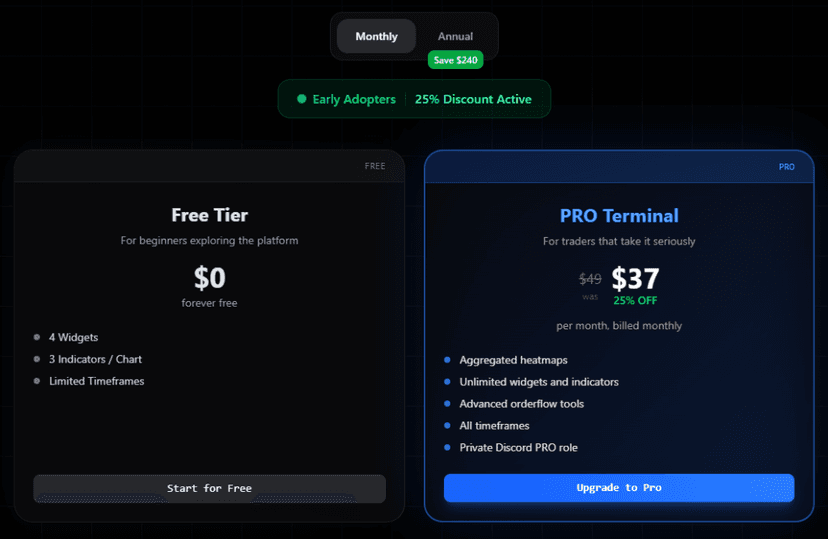
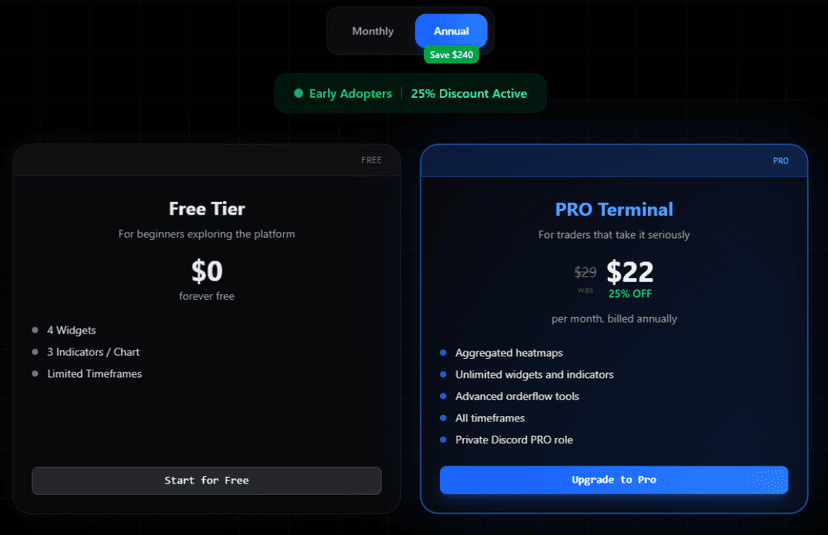
Market Monkey offers a free version that lets you get familiar with the platform’s environment, set up custom layouts, and access the main widgets like the chart, the order book, or the Tape. This version is ideal for discovering the core features and starting to structure your workspace.
For those who want to take their analysis further, the paid version unlocks additional tools such as the real-time Heatmap, the advanced DOM, the Volume Profile, the CVD, or even the TPO Charts. It also gives you access to more historical data, the ability to save multiple layouts, and a higher update frequency.
Data based on the major pairs from the leading exchanges
Market Monkey uses real-time data from USDT pairs (or others) sourced from the largest markets like Binance, Bybit or OKX to power its indicators.
Discovering the Interface
Flexible interface with customizable Layouts.
Quick access to the main widgets: Chart, DOM, Heatmap, Tape, Order Book, etc.
Smooth navigation: sidebar, user settings, shared templates.
The Chart
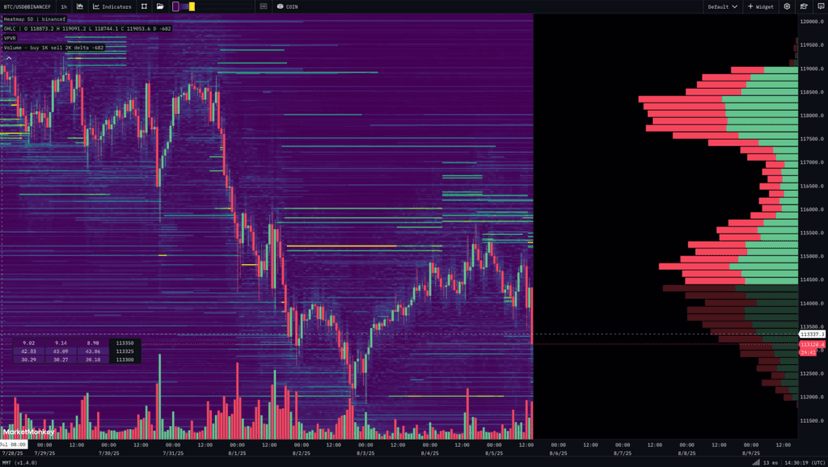
The Chart Widget is the visual heart of Market Monkey. This is where you analyze how price moves over time. It lets you watch the candles, the market moves, and the technical levels.
You can adjust your analysis to the timeframe: 1 min, 5 min, 30 minutes, or even several hours, depending on the strategy you’re using.
This chart is also useful for spotting key support levels, testing resistance zones, and pinpointing the areas where buyers could potentially step in. Above all, it’s designed for a fast, precise reading of price behavior, with the ability to switch from one asset to another in a single click. It’s your main point of reference, the one you build all your other tools around.
The chart is also useful for identifying specific prices, testing key levels, and spotting the support zones to keep an eye on
The Essential Widgets
Heatmap
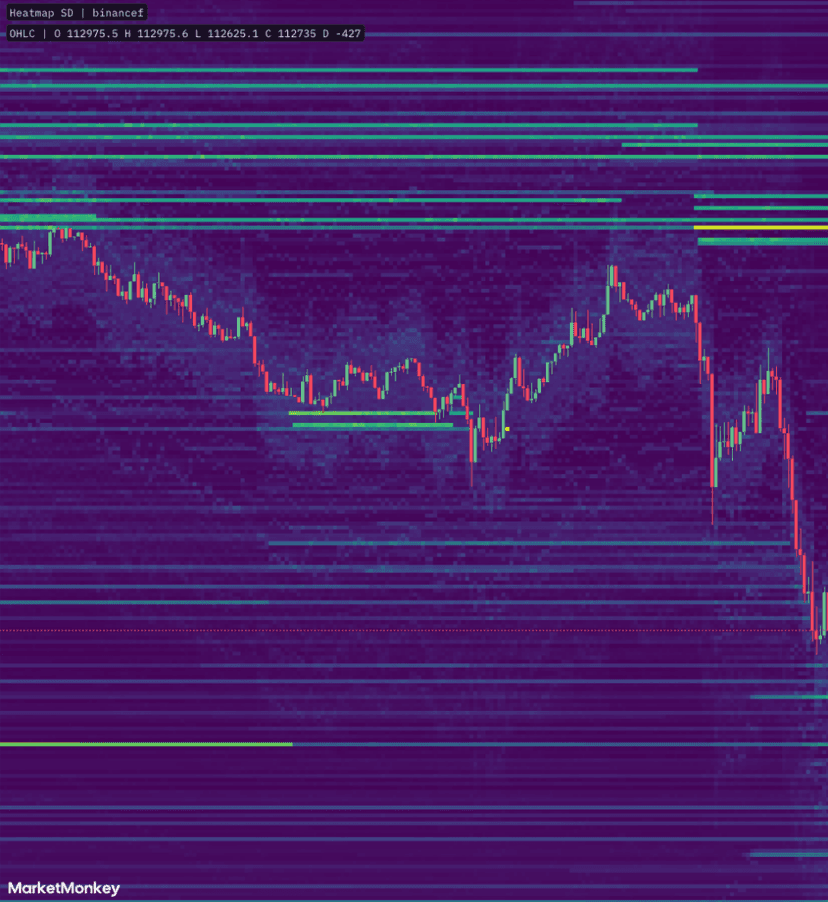
The Heatmap shows you, through color, where liquidity is concentrated in the order book. Orange or green zones signal a heavy presence of resting orders, while black or empty zones indicate little activity.
The upside? You can visually track where the big players are defending a level (absorption), or on the flip side, where the market could move quickly for lack of resistance. It’s a powerful tool for anticipating price moves before they happen.
DOM (Depth of Market)
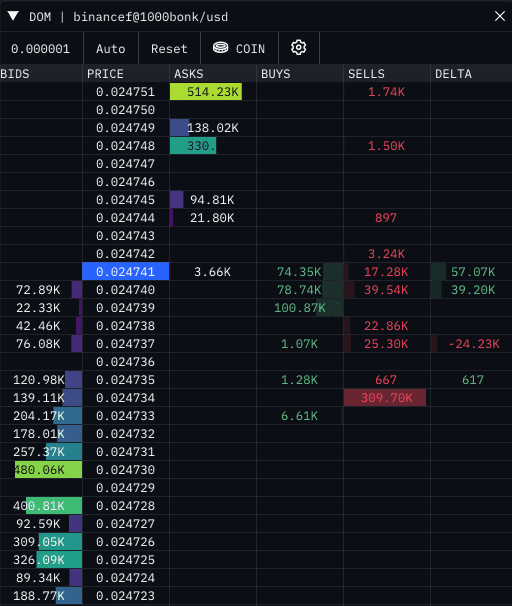
The DOM displays in real time every buy (bid) and sell (ask) order placed on the order book. So, price by price, you see how many contracts are waiting to be filled. It’s the ideal tool for feeling the pressure of the market.
For example: if you see a large resting quantity on the sell side just above the current price, it can act as temporary resistance. Conversely, a wall of buy orders just below can support the price. The DOM is heavily used by scalpers because it lets you spot entry or exit opportunities live, without waiting for the price to move.
Order Book
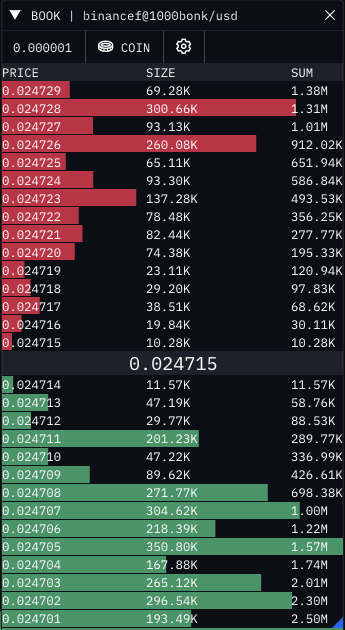
The Order Book displays all the active orders on the selected asset. In real time, you see:
the prices offered on the buy and sell sides,
the quantities tied to each level.
Unlike the DOM, which focuses on depth, the Order Book gives you a snapshot, balanced view of both sides of the market. It’s useful for detecting imbalances or anomalies in the behavior of passive orders.
Live Trade Flow
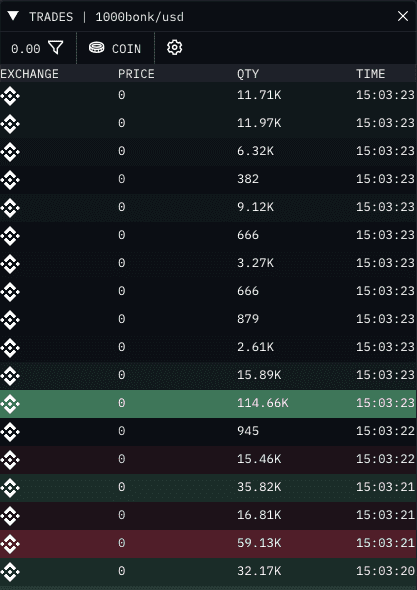
This widget lists every trade actually executed on the market. Each time an order goes through, it’s recorded here with its price, size, and direction (buy or sell). It’s like the market’s activity log, second by second.
By watching it, you can see:
whether buyers or sellers are dominant,
whether activity is picking up (a sign of interest),
or whether the market is slowing down (a sign of exhaustion).
Watching the live trade flow is like reading the market’s pulse.
CVD (Cumulative Volume Delta)
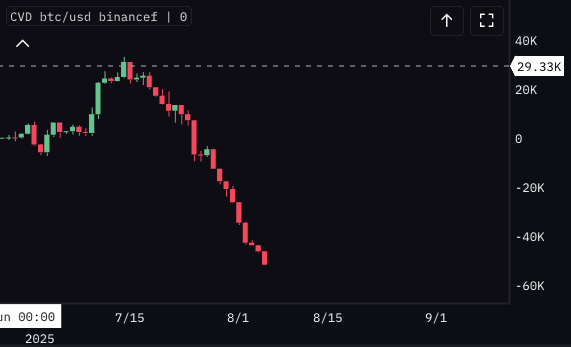
The CVD adds up every buy and sell volume executed at market to give you a precise read on who’s in control. If price rises but the CVD falls, it can signal a hidden divergence: sellers are gaining the upper hand despite the apparent rally.
By watching the trade volume and its direction, the CVD highlights the hidden imbalances you can’t see on a simple candlestick chart.
It helps you better understand the behavior of aggressive buyers and sellers, revealing who’s really in control of the market.
It’s a valuable tool for spotting:
potential reversals,
“trap” moves,
and the gaps between intention and actual execution.
TPO (Market Profile)
This widget shows you how long the market spent at each price level over a given period, which helps you spot zones of consolidation or decision.
spot the balance zones (Value Area),
locate the Point of Control (POC),
anticipate breaks of structure when price exits these zones.
It’s a contextual reading tool: it helps you understand the overall logic of the market across an entire session.
You can easily spot the Point of Control (POC), the Value Area High, or even the Value Area Low, to understand where trading activity was concentrated.
The Market Profile gives you a contextual view, used by many professionals in the financial markets to better anticipate the zones of interest.
Managing Your Layouts
A Layout on Market Monkey is a custom interface configuration you can build around your trading needs. This includes the arrangement of the widgets (Chart, DOM, Tape, Heatmap, etc.), the active indicators, the zoom settings, the colors, or even the crypto you’re analyzing. You can create several layouts tailored to different trading styles: for example, a minimalist layout for intraday trading, and a more complete one for ultra-short-term scalping.
Some layouts are useful for a long-term view, especially those that build in weekly or monthly volume profiles.
Each layout can be saved, loaded on demand, and even shared with other users. This flexibility helps you quickly adapt your workspace. It also lets you react better to market opportunities.
Final Thoughts on MarketMonkeyTerminal.com
Understanding a market is no longer just about watching candles or drawing a few supports. Today, traders who want to make serious progress have to learn to interpret what the order book data really reveals. Market Monkey offers an environment centered on market microstructure. It focuses on liquidity and volume dynamics. That helps you make more informed decisions.
This guide has walked you through the full set of tools on offer: visual widgets, advanced indicators, layout customization, and a fine-grained reading of buyer and seller behavior. By going beyond a simple charting interface, you step into contextual analysis. Every price zone becomes a potential signal. Every imbalance is an opportunity to understand, not to guess.
But mastering these tools doesn’t come in a single session. It’s earned over time. It comes through confronting the markets and experimenting. Post-trade analysis matters just as much. You have to carefully watch the zones of real activity. That includes the Value Area High, the POC, and the levels where trade volume is telling.
To deepen your skills, we provide:
A community space on Discord, where you can ask your questions, compare your analyses, and grow alongside other Market Monkey users, completely free.
An educational YouTube channel, designed to teach you how to handle the tools, build your own methodologies, and approach the market with real structure.
The technology is here. The information is available. Now it’s up to you to turn reading the market into a strategic edge.
FAQ
1. Is Market Monkey suitable for beginners?
Yes — thanks to its modular logic and its video tutorials, the learning curve is gradual. Even with no experience in order flow, you can move forward step by step.
2. Can you trade live with Market Monkey?
No, Market Monkey is not an order-execution platform. It’s an advanced analysis tool that complements your trading platform.
3. Which trading strategies can you learn to use with Market Monkey?
Courses like Order Flow and SFP V3, on Captain‑Trading.com, are a perfect fit to take things further.
4. Does Market Monkey offer a free version?
Yes, a free version is available to explore the interface and the basic features. Paid options let you go further with the advanced tools.
5. Do you need to know how to code to use Market Monkey?
Not at all. The interface is entirely visual and intuitive. No programming skills are required.
6. Is Market Monkey useful beyond crypto?
Yes — even though it’s mainly used for crypto, the indicators apply just as well to futures, indices, and commodities.
7. Can you use Market Monkey on mobile?
Not for now. The platform is optimized for use on a PC or a wide screen, so it can display several widgets at once.
Definitions to Get Comfortable with Market Monkey
DOM (Depth of Market): A real-time vertical view of the resting buy and sell orders. Perfect for spotting defensive zones or the liquidity walls where price could react.
Order Book: The classic order book with the price levels and the quantities on the buy and sell sides. This is where you read the market’s intentions and shifts in behavior.
Heatmap: A color-coded representation of the high-liquidity zones in the order book. The brighter it is, the more it draws attention. Useful for seeing where price could be stopped or sucked in.
VPVR (Volume Profile): Shows the price levels where the most volume has been traded over the visible period. That’s how you spot the building, support, or resistance zones.
TPO (Time Price Opportunity): An analysis based on the time spent at each price. It shows you the zones where the market “took its time” and those where it was faster or more aggressive.
Value Area: The zone where the majority of activity was concentrated (often 70% of the volume or time). It gives you a sense of the market’s balance over a session.
POC (Point of Control): The price level where the market was most active. Often a magnet for price, or a key reversal point.
CVD (Cumulative Volume Delta): A continuous measure that shows you whether aggressive buyers or sellers are in control. Super useful for spotting subtle divergences.
VWAP: The average price weighted by traded volume. It’s a kind of “fair” benchmark that many institutions keep an eye on.
Order Flow: Reading participants’ behavior live through order executions, pressure, volume, and so on. You’re no longer trading a candle — you’re trading what’s behind it.
Liquidity: The amount of orders available at each price level. The higher it is, the more stable the market. The lower it is, the more volatile and fast it becomes.
Absorption: When a level holds despite heavy pressure. You see buyers charge in… but a seller absorbs it all without the price moving. It often smells like a rejection.
Spoofing: Manipulation where a trader places large orders “to scare people off” and pulls them before they’re executed. The heatmap can sometimes show it to you if you look closely.
Imbalance: A situation where one side of the market (buyers or sellers) clearly dominates. You see it in the DOM or the CVD, and it can trigger fast moves.
Limit Order: A limit order lets you decide the price at which you want to buy or sell. You set your price in advance, and the order will only be executed if the market reaches that price. It’s useful for not paying more than planned, or for selling at a precise level. On the downside, it may never be executed if the market never touches your price.
Market Order: A market order is an order you send immediately at the market price. It’s executed right away at the best available price. It’s the fastest option for entering or exiting a position, but you don’t have exact control over the price you pay or receive.
Every guide here is free. Browse the full course and join a community of traders who share ideas every day.