The Order Flow concept, just like that of Order Block, is part of the trading system developed by ICT: the smart money concepts (SMC). And in fact, it’s one of the SMC concepts I use the most; so here’s my completely free Order Flow course!
By the way, a quick reminder that I mainly use Exochart to analyze Order Flow, but you can also use Quantower.
Finally, if you already have a solid grasp of the theory, the Order Flow & Footprints course goes further than this guide: it offers a few turnkey strategies directly tied to the analysis and interpretation of this technical tool and indicator.
Order Flow Definition
Order Flow literally means the “flow of orders.” When we analyze order flow, the charts show the volumes traded as a function of supply and demand, not just as a function of price. As a result, instead of only seeing the prices at which trades were executed, we can also see the volume of trades on both the buy and the sell side.
Because it relies on real-time data, order flow analysis has the advantage of providing valuable insight into market conditions and market psychology. It also helps confirm peaks and troughs, helps us see where supply and demand have shifted, and much more.
O.F & Day Trading Strategy
A traditional Japanese candlestick chart only plots price movement, showing the open and close prices and the upper and lower wicks for a given timeframe. An order flow chart, on the other hand, also shows the amounts bought and sold. In other words, you can clearly see the strength of the sellers and the buyers.
Order Flow Trading
Advocates of order flow analysis believe that a trader should focus on how the market is moving and not get distracted by external fundamental data.
For example, fundamental analysis can make effective predictions over the long term, but it can be completely wrong over the short term. So if we want to trade short-term moves in the markets, we shouldn’t rely on fundamental data, especially the data served up by mainstream and financial media.
Order Flow: Reading & Interpretation
Order flow trading (OFT) consists of observing and analyzing the flow of trading orders in order to anticipate price movements. In other words, order flow analysis lets us see how other traders are positioning themselves on the buy or the sell side.
Order flow trading is also known as “tape reading” or order flow analysis.
Order flow analysis helps us recognize the latest buy and sell volume data and lets us focus on studying Price Action by analyzing the variations in the Japanese candlesticks: analyzing Price Action through order flow thus gives us a great deal of useful information.
In fact, we can think of order flow trading (OFT) as a volume-based trading system.
An order flow chart will show you exactly how many buy and sell orders were executed at each price level.
The depth of market (DOM) shows the intent of buyers and sellers. However, when these buy and sell orders turn into market orders and get executed, that shows up on the price chart.
To go further, it’s essential to master two skills, namely:
- Reading order flow.
- Trading order flow.
Order Flow: Trading in Practice
In classic technical analysis, the goal is to look for zones or price levels to trade. In order flow analysis, by contrast, we look for clues about the best time to trade and the optimal price to do it.
Order flow trading (OFT) can give us information about:
- The large buy and sell orders that could influence the market price.
- The momentum of buying and selling.
- The flow of liquidity based on the size of the buy and sell orders: small, medium, or large.
- The weakening of momentum: when order flow dries up, it can signal a price reversal.
- Stop hunting.
- The place (on the chart) where buyers and/or sellers are trapped.
Order Flow Trading & Footprint Charts
A footprint chart, also called a Footprint Chart, lets us see the amount of volume traded at specific prices within a Japanese candlestick. In other words, with a footprint chart, we can see inside each candle and pin down exactly how the buy and sell orders were placed and at what price.
Footprint charts (FPC) highlight how aggressive buyers and sellers are. Analyzing them lets us see where the large stock of orders sits and compare it to what the market is doing.
Footprint Charts
It’s the record of the transactions that actually took place that shows the current state of the market, not that of the announced transactions (limit orders) — i.e., the ones likely to occur if a certain price is reached.
The essence of order flow trading (OFT) is to react to market action, which is illustrated by the daily traded volume.
In fact, what we see on the footprint chart (FPC) is all the orders executed at market price. This can help us compare supply volume to demand volume and assess whether it’s the buyers or the sellers who control the market.
Next, it’s about knowing how to interpret footprint charts (FPC) according to our order flow trading (OFT) strategy.
A Trading Strategy Combining Order Flow and Footprint Charts
Using Footprint Charts (FPC)
- Using these charts helps us develop a more complete view of the market.
- Footprint charts (FPC) contain all the data related to price and to order flow (volume).
- For each bar and each price level, the footprint chart (FPC) displays the volume traded at each price.
Key Concepts of Order Flow Trading (OFT)
Every footprint chart (FPC) has three essential pieces of data:
- Each row of the footprint chart (FPC) develops at a specific price.
- The bid-ask volume indicator displayed in the cell.
- Order flow: green numbers indicate aggressive buying and red numbers aggressive selling.
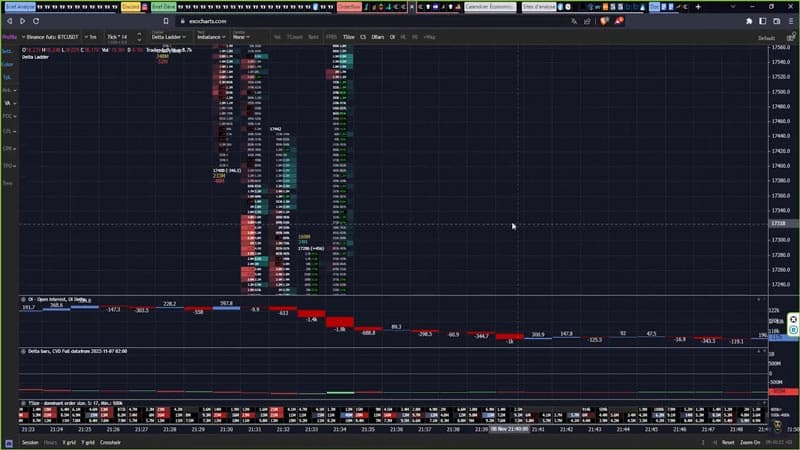
Note*: the point of control (POC) is the price at which the largest trading volume occurred on each footprint.
If we break down the footprint chart (FPC), taken from Exochart, we can observe two things:
- The bids on the left-hand side
- The asks on the right-hand side
You can start to get a sense of the relationship between bid volume and ask volume.
If an aggressive seller wants to enter the market, they have to hit the bid. Conversely, an aggressive buyer can’t wait for a limit order to be filled — they have to demand execution at market (a market order). This entire process is reflected in the footprint chart (FPC).
Using FPC to Anticipate Supply, Demand, and PRICE!
When buyers become more aggressive, the number turns green. This means there are more buyers than sellers. Conversely, when sellers are more aggressive, the number on the footprint turns red.
Prices move when there’s an imbalance between supply and demand. As traders, we need to focus on recognizing these imbalances.
When you see successive accumulations highlighting these imbalances, it generally shows that market participants (buyers or sellers) are becoming more aggressive. This way, we can look to qualify trades based on where these imbalances occur.
For example, if the footprint shows a buy imbalance in the lower part of the range, that generally represents a potential support level.
However, if we see a significant buy imbalance at the top of the candle, it can point to trapped longs and a possible reversal.
The same is true, in reverse, in the case of a sell imbalance.
Order Flow Analysis = Technical Analysis?
Given the approach used for order flow analysis, some might think it’s just another form of technical analysis, but that’s not quite accurate.
Technical analysis relies on using tools that are mathematically programmed to make an assumption about where price changes might occur; for example, the Fibonacci retracement tool is commonly used in technical analysis.
Order flow analysis, on the other hand, lets traders see how the market is moving in real time, thanks to the statistical information mentioned earlier. So order flow analysis lets you make immediate, well-informed decisions which, set alongside technical analysis instruments, strengthens a trader’s ability to minimize losses and maximize gains.
Order Flow Analysis: Benefits
While price is a function of supply and demand, as technical analysis assumes, that’s not the whole story. Supply and demand are driven by people’s emotions and their current and future needs
Order flow analysis lets us clearly see where buyers and sellers enter the market. An order flow chart lets us gauge the strength of buyers and sellers, spot weak troughs and peaks, and much more. Essentially, it lets us make far more informed decisions.
It also lets us see what’s happening in the market at a precise moment, which helps us make the most of trading opportunities as they arise.
Order Flow: My Take and Conclusion
In conclusion, order flow trading offers many advantages:
- It helps us see when market behavior is about to change, at the very moment it happens.
- It shows us the reasons why price changed direction at a particular level.
- It reveals shifts in the dynamics of supply and demand, so you know whether or not you should exit a trade that could turn into a loser.
- It lets us pinpoint the best time to open a trade.
- It lets us trade with far less risk and stress.
Order flow trading (OFT) cuts out the noise, letting traders focus on what’s actually happening in the market. After all, a chart crowded with a multitude of indicators may suggest that price is going to rise, but that’s not necessarily what will happen. Likewise, fundamental analysis may suggest the market is going to correct, but what looks like it should happen is, far from always, what actually happens.
If you think Order Flow is a technical indicator worth your time, I recommend a course that goes further and is accessible to everyone, Order Flow & Footprints!
Feeling fired up to analyze Order Flow and turn it into an Edge?!
Then I recommend 2 sites on top of the course above!
If you’re still missing a few concepts, I invite you to do a quick re-read! I also have a tutorial on YouTube that might give you a hand with a few practical examples! For more free trading education, there’s my free trading course of course. Maybe my free courses on Market Profile and Volume Profile will interest you as well…

Every guide here is free. Browse the full course and join a community of traders who share ideas every day.