The Market Profile is a technique built on the analysis of intraday charts (price on the vertical axis, time/activity on the horizontal one), designed by J. Peter Steidlmayer, a trader at the Chicago Board of Trade (CBOT), between 1959 and 1985. If you already want to run your own technical analysis with the Market Profile, I recommend you get to grips with TradingView.
Steidlmayer was looking for a way to determine and gauge the market’s value as it developed throughout the day.
The idea was to plot price on a vertical axis against time on the horizontal axis. The resulting chart is usually bell-shaped: pronounced around the average prices, with falling activity and reduced volume at the extreme prices (the highest and the lowest).
This structure represents a “normal,” Gaussian distribution.
The chart that introduced the theory of the Market Profile was presented to the public in 1985.
Market Profile: Definition
A simple definition: it is a data-organization tool.
Here, moreover, is the definition given in the book Mind Over Markets: “market price activity recorded as a function of time in a statistical bell curve.”
The market profile is therefore a unique way of organizing market-generated information.
Some professional traders use it often, because they are convinced it is the best way to watch the Price Action as it unfolds.
Market Profile: the market’s profile
POC: Point of Control
CBOT: Chicago Board of Trade — the Chicago exchange
TPO: Time Price Opportunity — a price opportunity to be seized at a specific moment
Although it is not a trading strategy in the strict sense, it helps us see and define trends and ranges more clearly.
In other words, the market profile shows us where market participants have agreed on the fair value of an asset!
But it also shows the areas where the asset was overvalued or undervalued.
Because the Market Profile tracks both price and time, it shows us market activity in the context of how it develops.
One significant advantage of a market profile is that it can be used on any market you like, such as Forex, futures, cryptocurrencies or stocks.
To display the data, the market profile uses TPO charts.
CBOT: the CBOT Market Profile
The Market Profile links the CBOT data to the market. An M.P. chart should be used to indicate “what the market is doing.” The price at the peak offset volume is identified as the point of control (POC).
Following the normal-distribution analogy, the central seventy percent of trading activity around the POC (+/- one standard deviation) is called the “value area.”
In 1987, Professor Thomas P. Drinka of Western Illinois University launched the first Market Profile course in academia.
As of 2010, Western remained the first and only academic institution to offer such courses as part of its curriculum.
A new 335-page manual on the CBOT Market Profile, CBOTMP2, was published in 1991.
In this volume, the first five sections are devoted to profile analysis. Between 1985 and 1991, the concept of the “market profile” was adopted by the public. In fact, in a Chicago Tribune article, Steidlmayer was described as “the man who knows where the market is going.” That is real recognition!
In early 1986, Steidlmayer and Kevin Koy founded the Market Logic School to teach trading according to his market-profile method.
Market Profile & Time Price Opportunity (TPO)
Time Price Opportunity: Definition
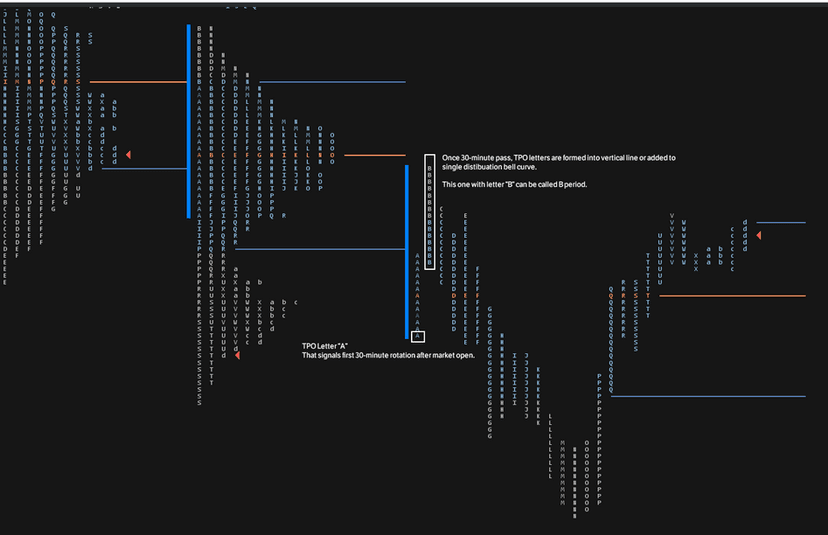
The Time Price Opportunity (TPO) is one of the building blocks of the Market Profile chart.
Each TPO represents a moment when the market traded at a specific price.
A single TPO is shown on the chart each time price touched it during the same period.
The default and most common TPO settings are usually time intervals of (15 or) 30 minutes.
The same prices are shown on the TPO chart only if the market comes back to trade them during another 30-minute period over the course of the trading day.
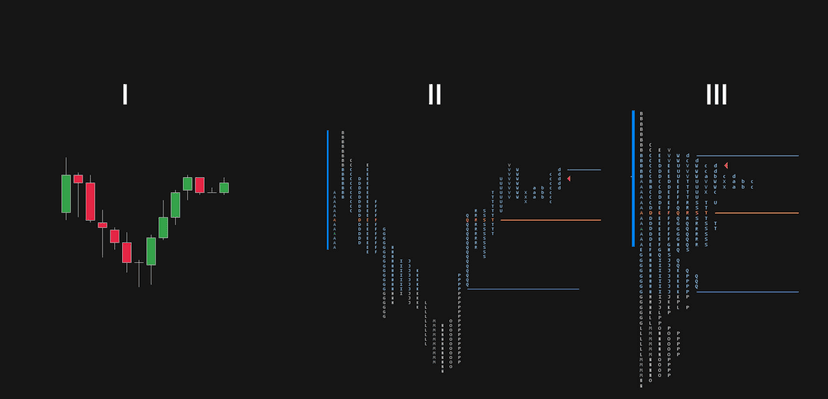
I. Japanese candlestick chart.
II. An expanded TPO chart starting with an A period.
The green letter tells us the price at which the market opened for a given session.
The arrow to the right of the profile shows us the closing price.
III. Once the sessions are over, the Market Profile can be collapsed to express the final distribution.
Market Profile: Reading and Interpretation
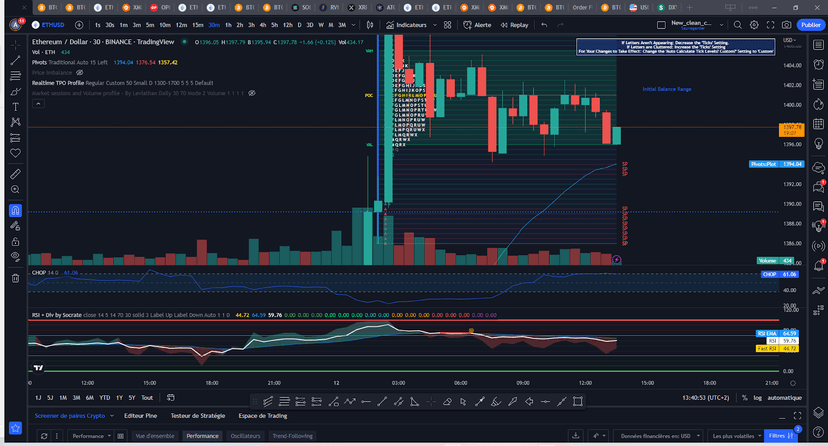
Market profile charts display price on the vertical scale (the y-axis). Volume appears on the horizontal scale (the x-axis), and the timeframe uses a combination of letters and/or colors. Understanding price is fairly simple, but the volume and time-horizon components are slightly more complicated.
Market profile charts display price the same way as any other day-trading chart, with the price scale shown on the right-hand side of the chart.
Volume on a market profile chart is shown as a horizontal histogram, with the longest horizontal lines representing the largest trading volume. This price is also called the “point of control” (POC), because it is the price that controlled the market the most.
The timeframe of a “market profile” chart uses letters and/or colors. Each letter represents one unit of the timeframe when letters are used, such as five minutes or one hour.
For example, a 15-minute chart may use colored squares, each one representing 15 minutes of trading. A trader can then easily see which prices were traded most recently if they know which color is being used.
There are other indicators and zones to highlight and note on market profile charts. The selling and buying tails represent the lowest buy and sell TPOs for the trading period, while the value area represents a generally accepted 70% of the TPOs.
Market Profile: Trading with the Chart
Market profile charts can be used as all or part of a more complete or broader trading system.
The market profile chart generally lets you trade on the basis of support and resistance prices (where the market cannot sustain a lower or higher price: the technical zones). This plays out according to how prices interact with the point of control.
A day trader may trade bounces (trading at a support level) off the most recent point of control, while a swing trader may trade breakouts (trading at prices that have broken through the resistance or support level) of the previous day’s point of control.
As with all techniques and methods, using a market profile chart takes practice. There are a number of trading simulators that can give you the practice you need to become comfortable trading futures. You will know you are ready when you feel comfortable enough to put your money in without any particular stress.
It is generally accepted that volume helps identify signs of continuation or reversal, making it easier to infer the direction of a trade.
That said, “volume data, on its own, means nothing.” The reason given is that it is essential to know what market participants are doing. Different “profile readings” make it possible, within this trading system, to infer who is trading what and what signal they are sending. This can involve, for example, seeing whether volume rises on the up moves or on the down moves during the day.
- At the start of the day, the first hour of trading creates a range: the initial balance.
- Then, as further information about the day’s trading comes in, certain chart formations, called “day types,” are recognized. These formations carry names such as “neutral day,” “non-trend day,” “trend day,” and so on.
Another concept was also developed by Steidlmayer: the “ third standard deviation ” (or Steidlmayer distribution). This distribution begins when you observe a move away from equilibrium.
Market Profile: How to Determine the Day Type?
The market profile can help you spot trend days. And we all know that having a clear bias considerably improves our results.
For example, when each impulse move pushes the price toward a higher high, and each pullback creates a higher low, we can say we are in an uptrend.
Objective and Subjective Elements of a Profile
The objective part of a Market Profile is the display of the profile. It comes directly from the data itself, creating TPOs (either from LDB data or from tick data). Among the key elements: the initial balance, the range, and the price during the first hour of trading.
Steidlmayer identified a few patterns of price behavior, or “Day Types,” at the start of the day. They are tied to the initial balance.
Each day type develops characteristics indicating which type of trader is in charge:
- short-term traders (Short Time Frame Traders – STF)
- long-term (Long Time Frame Traders – LTF)
The “Day types” correspond to chart reading and forecasting.
The well-known problem with interpreting charts is the multitude of potential interpretations for most charts.
Mastering the theory offers some hope to traders who are willing to devote the time and effort to understand the auction-market environment. But this path can take 10,000 hours of training. That said, it is noted that it will usually take six months to a year to learn the Market Profile methodology.
The Limits of this Method
1. The first condition for a valid profile is a normal, balanced distribution. If the market is not in balance, there is no valid point of control (POC) or standard deviation.
A simple visual inspection will often be enough to confirm that the distribution is abnormal: the day may have two distributions (two peaks), or trading may be directional, and so on. Although improper, unbalanced data can still be processed as usual by a computer program, the results are likely to be meaningless or misleading. Most traders who use profiles do not seem aware of the normality requirement.
2. Even on broadly balanced markets, there can be days when market prices break out of the boundaries (false breakouts or “fake-outs”) and come back later in the day or the next day. A single day’s profile does not provide a reliable measure of the state of the market. Research indicates that a three-day measure is preferable.
3. The markets have changed since the 1985-1991 period. The trading pits are gone. In 1985 and before, trading in the pits was done by “open outcry”; commercial traders were visible and “the trade” dominated the markets. Today there are no more pits, and public traders dominate trading volume. It is certain that a smart, watchful trader like Steidlmayer had far more information in the pit than the mere profile chart available today.
4. Profiles were defined to use LDB (Liquidity Data Bank) data. The point of control (POC) is the price at the maximum offset volume. Yet few traders today have access to LDB data.
Research into replacing offset volume with TPOs has shown that TPOs are reliable for locating the point of control. The point of control of the TPO Meta-Profile is not an exact copy of the Market Profile’s point of control. Meta-Profile users should be aware of these differences and of their potential implications when trading.
5. For more accurate results, it is often better to use the “Volume Profile”, which is based purely on volume and price without taking the time variable into account.
How to Get the Profile Chart?
You can find market profile charts fairly easily. Your broker or exchange is likely to offer them; otherwise, there is TradingView.
As is often the case, this technique or method cannot be treated as the absolute truth!
It should be cross-checked with your usual indicators and methods in order to pin down interesting points of confluence!
To be effective in interpreting the Market Profile, you first need, in my view, to have a solid command of the basics: price action analysis.
Every guide here is free. Browse the full course and join a community of traders who share ideas every day.