Never heard of VWAP?! Well, here’s your chance to fix that! It’s a technical indicator called the Volume Weighted Average Price — or, in plain terms, the average price weighted by volume.
This tool is used in technical analysis by algorithms and institutional traders across the financial markets.
The VWAP indicator is plotted as a line, just like the moving averages you find on a chart. It’s an indicator built for day trading – intraday strategies.
How the VWAP Is Calculated
The Volume Weighted Average Price is calculated by taking the average of the session’s high, low and close. That average price is then weighted by the total volume traded over the daily session.
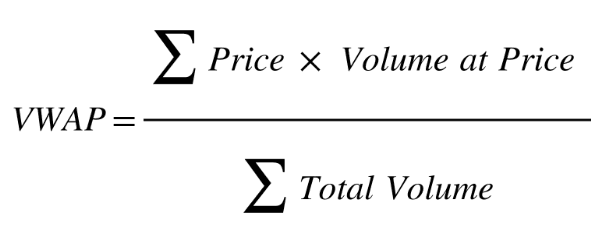
Volume Weighted Average Price = (Average Price * Volume) / Cumulative Volume
It’s worth noting that, by default, the indicator resets at the start of every session — that is, at the daily close. That makes it a perfect fit for traders working on timeframes below one hour.
Volume-Weighted Average Price vs. Moving Average
Even though this indicator can look similar to moving averages, the two are calculated in completely different ways.
The Volume Weighted Average Price is calculated by multiplying the average price by the cumulative volume, then dividing the result by the total volume.
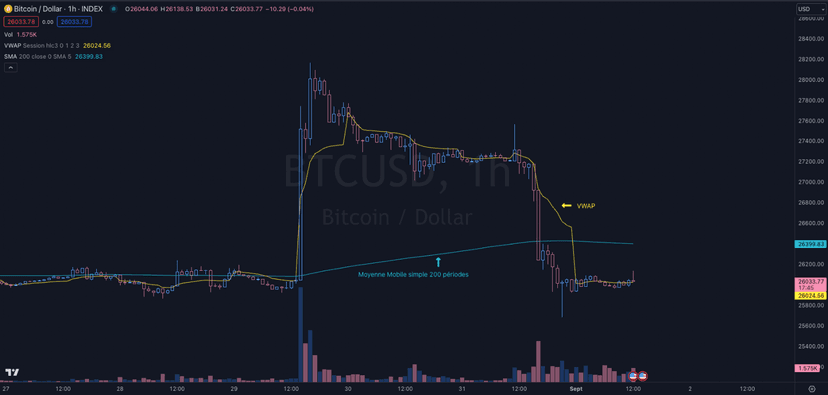
A simple moving average (SMA) factors in price, but not volume.
The SMA is calculated by summing the closing prices over a chosen period (200 days, for example), then dividing that total by the number of periods (200).
VWAP on TradingView
To find this technical indicator on TradingView, open the “Indicators” window, type vwap into the search bar and select:
That’s the Volume Weighted Average Price, or VWAP for short.
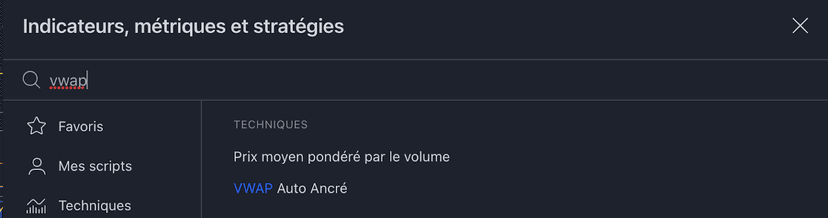
As a reminder, the VWAP is calculated over a session — that is, over a daily period.
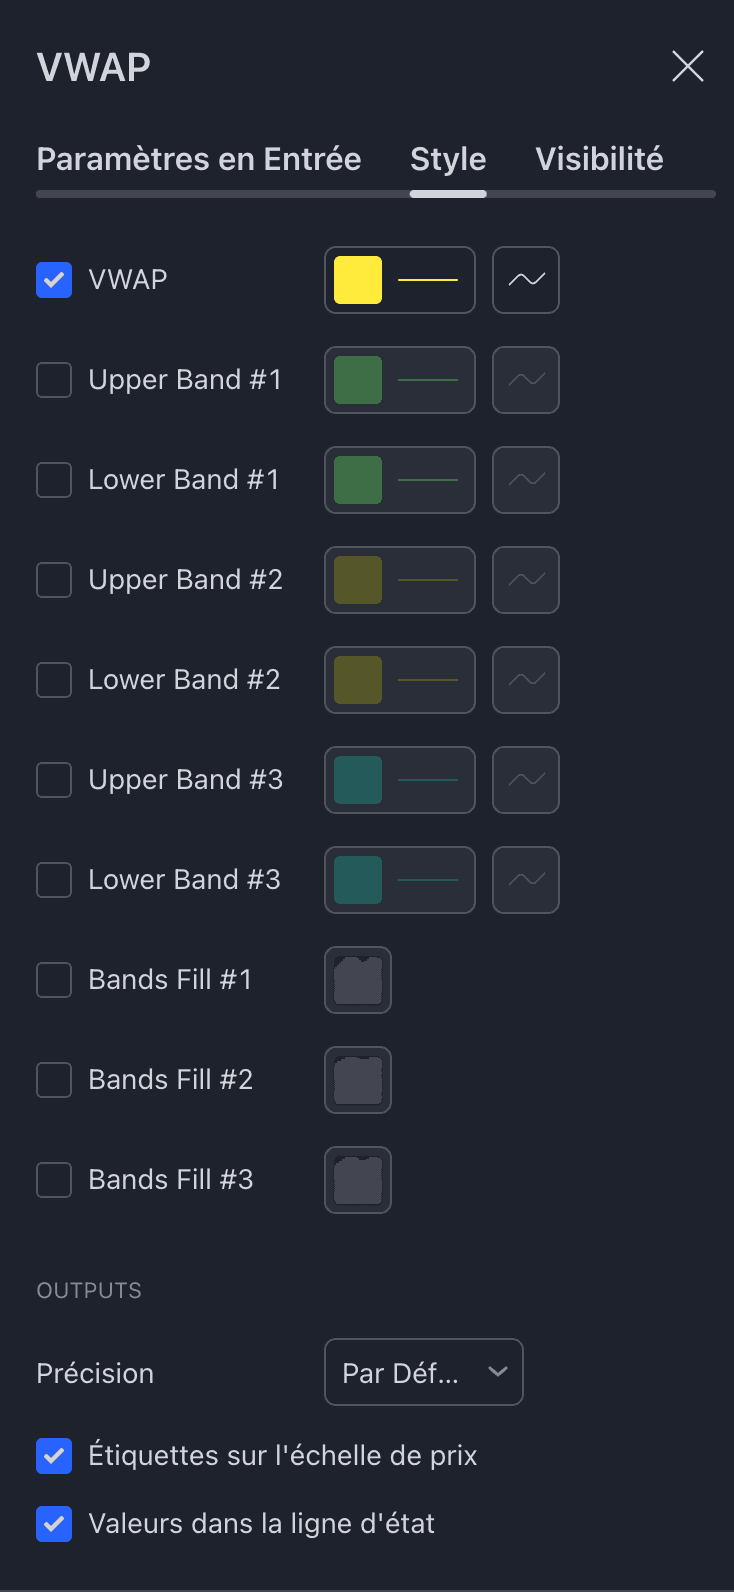
As for the configuration settings, the only tab I change is the Style tab, like this:
Once the technical indicator is added, here’s what your chart looks like:
The Rules
- As you now know, the VWAP resets at the start of each session, so I find it less reliable during the first few hours.
- I recommend using it for scalping, and I favor my entries between the 1-minute and 5-minute timeframes.
- I’m cautious when price ranges around the VWAP without pulling away — that can give conflicting signals, so I’d rather wait for a reaction from price.
- I NEVER trade an immediate cross between price and the VWAP. I much prefer trading pullbacks once the indicator’s line has been clearly broken.
Identifying Trends
Spotting trends is a major advantage of using this technical indicator. The principle is very simple, yet it can be extremely useful — especially when you use it to confirm trading signals.
- An uptrend is characterized by price trading above the VWAP line.
- A downtrend is characterized by price trading below the VWAP line.
- A sideways market is characterized by price trading both above and below the VWAP line.
That said, keep in mind that I use the Volume Weighted Average Price on low timeframes, so these are not what you’d call long-term trends.
Support and Resistance
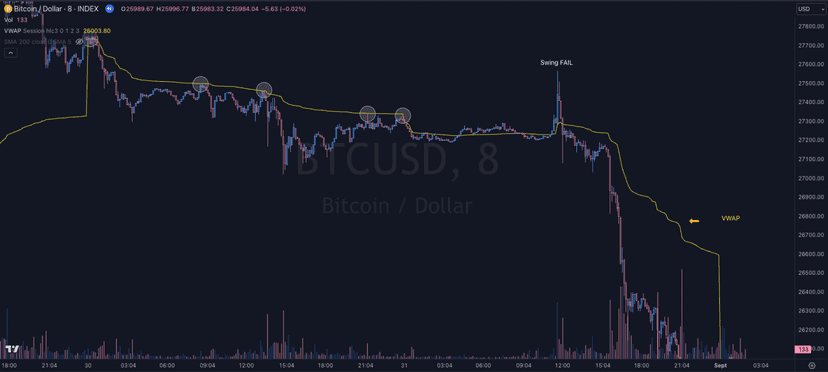
One of the simplest ways to use the VWAP is as support/resistance, exactly as you would with a moving average.
It can be worthwhile to look for entry or exit points there.
Finding an entry point isn't the same as sizing the trade: if you execute on MT4/MT5, Trade Assistant converts your stop into a position size — the VWAP gives you the level, the add-on gives you the size.
Entry Point
If PRICE is below the VWAP, it’s better to look for shorts rather than longs.
If PRICE is above it, it’s better to look for longs.
When price pulls sharply away from the indicator’s line, it points to a strong trend. The longer it stays detached, the stronger the move.
In cases like this, a retest (pullback) offers a great high-probability setup
VWAP Trading: A Worked Example
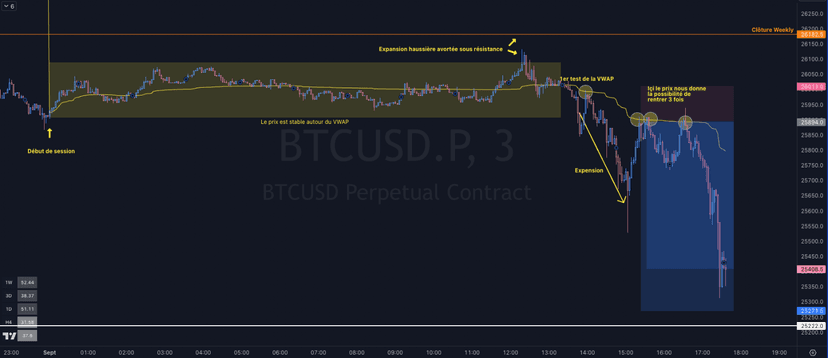
I NEVER take a trade based on the VWAP alone.
I always look for confluence with technical elements like Fibonacci, support and resistance and, of course, Price Action in general!
Anchored VWAP
As we saw earlier, the VWAP resets by default at every session close.
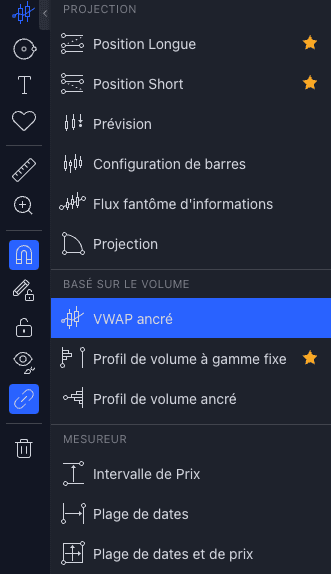
However, TradingView offers the Anchored VWAP which you can find directly in the tools palette.
What Is the Anchored VWAP Used For?
I use the anchored VWAP (Anchored VWAP) on one very specific move.
In the example below, I anchored the VWAP to the start of a bearish move that broke a key support.
You’ll notice that price tests the VWAP once before breaking above it, at the same time as the support that had turned into resistance.
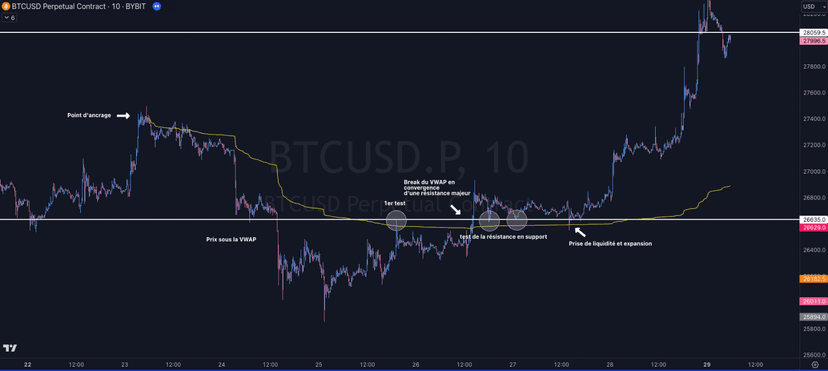
It’s important to note that, unlike the standard VWAP, the ANCHORED VWAP does not reset every session — it’s continuous over time.
VWAP – Conclusion
The VWAP is a valuable indicator in my scalping strategy, especially when it gives me confluence signals with other technical elements.
That said, theory is only theory — so don’t hesitate to run backtests and play around with this indicator until you’re comfortable with the tool before taking your first trade.
And there’s no doubt that plenty of strategies exist around the VWAP.
Feel free to share yours with me on my DISCORD.
Every guide here is free. Browse the full course and join a community of traders who share ideas every day.