The CVD is a volume indicator: candle after candle, it adds up the gap between the volume bought and the volume sold at market — hence its name, Cumulative Volume Delta. It shows which side, buyers or sellers, really controls price.
In this Indicators & Technical Analysis course, we’re going to look at how to read the CVD in trading and how to use it to act consistently across the financial markets — the crypto markets included!
When you take a fresh look at the markets, Japanese candlestick patterns and price action can look messy, even completely random — especially when it comes to the crypto market, right?!
However, at a deeper level, and as you gain experience in the markets, you’ll find there’s always a very good explanation hiding underneath. Depending on the trading style, the time horizon, the tools and even the technical indicators, the price chart, and so on, are essential for Price Action traders and analysts.
The essentials:
- Delta is buy volume at market minus sell volume at market: only aggressive orders count, the ones that go hunting for liquidity in the orderbook.
- The CVD accumulates these deltas candle after candle: the slope of the curve tells you who’s really in control of the market.
- Two reads are all you need: delta weakening and delta divergence — equal highs on price against progressively lower highs on the CVD.
- The CVD isn’t available on TradingView: I display it on Coinalyze, Velo Data or Market Monkey.
- It doesn’t work every time: no single technical indicator gives you the Holy Grail — the CVD gets crossed with the rest of your analysis.
Volume Analysis and Price Action Are Complementary!
Since Price Action is a complete representation of all the fundamental and/or technical events affecting a tradable asset. Unfortunately, it isn’t enough just to learn the ebb and flow of price action. You have to go further when the markets show complex or seemingly “disorderly” behavior.
With even a little experience, any trader can notice that volume is a valuable tool that offers excellent insight; in fact, it’s essential to look at it more closely in order to anticipate major moves.
Pure Price Action is mainly aligned with supply and demand dynamics. The greater the supply, the higher the price, and vice versa. So far, nothing complicated, right?!
At any given moment, the price of an asset — whether it’s the XRP price, Bitcoin or any other coin — is at equilibrium. It’s a price the market has unanimously recognized as fair at a given moment in time!
To go further, every trader must analyze volume with whichever technical indicator, or indicators, suit them best!
Analyzing Volume Gives You an Undeniable Edge!
The great advantage of analyzing volume is that you get it in real time.
Not only is it available in real time, but it can also give you a sense of the trading strategy used by the biggest wallets — and therefore the market leaders (see the Composite Operator / Wyckoff concept)! And yes, in case you had any doubts, retail traders have never set the direction of a market!
There are many volume-based indicators. Regardless of your experience, a thorough understanding of these volume-based indicators is essential.
Among them, the Cumulative Volume Delta, or CVD!
How to Find the CVD
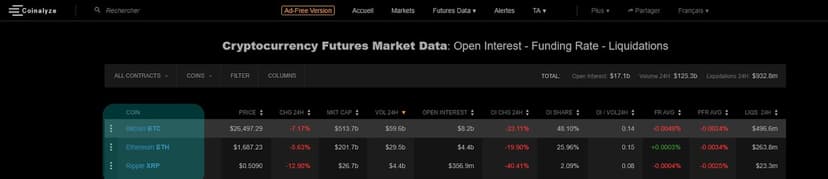
1. Go to Coinalyze and create a free account by entering an email, a password and a username. It’s completely free; they do have a paid version that costs a few dollars, but it isn’t essential.
2. Click on the name of the coin you’re interested in | highlighted in blue
3. Once you land on the page of the coin you want to analyze, you’ll notice you can compare the price directly against 3 technical indicators (which I particularly like). They are:
- Open Interest
- Funding Rate
- Liquidations
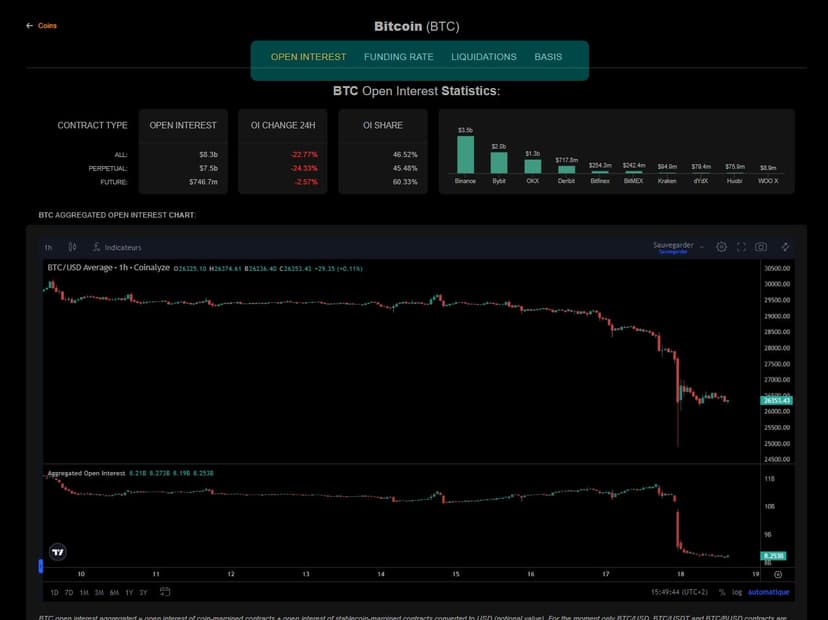
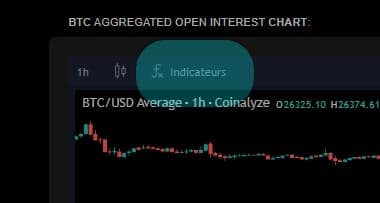
4. Once you’ve set the indicator you want to compare against price and the CVD, all that’s left is to find the CVD in the list of indicators!
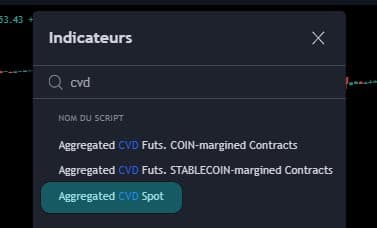
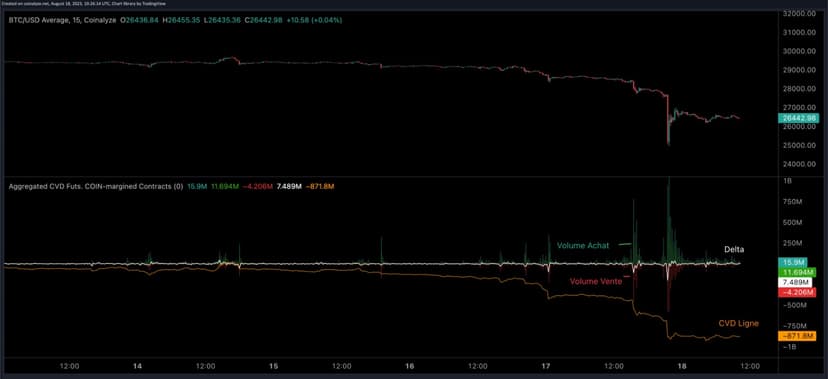
And here’s the result!
What Is the CVD (Cumulative Volume Delta)?
Delta: Definition
To understand what this indicator does, you first need to understand what a “delta” is.
Simply put, a delta is the difference between buy and sell volume within a period or a candle: 1 day, 1 hour, 2 hours, 15 minutes, and so on.
On the chart above, the green bars represent buy volume while the red bars represent sell volume.
The delta can be positive (buy volume is higher than sell volume), negative (buy volume is lower than sell volume) or zero (buy volume equals sell volume).
Cumulative Volume Delta: Definition
The Cumulative Volume Delta, or CVD, indicator is based on these deltas. It starts from an origin bar specified by the user and successively cumulates the deltas.
What’s interesting about the CVD is that you’re free to specify the origin/starting bar, and therefore the accumulation period of your choice. Here’s how the CVD is calculated.
For example, if you specify 10 as the origin bar, then:
CVD at bar 10 = delta at bar 10
CVD at bar 9 = delta at bar 10 + delta at bar 9
CVD at bar 8 = delta at bar 10 + delta at bar 9 + delta at bar 8
… and so on
If you want the CVD to start from the very first bar, simply enter “0” as the origin bar.
Here’s an example of the CVD on the BTC/USD pair (90)
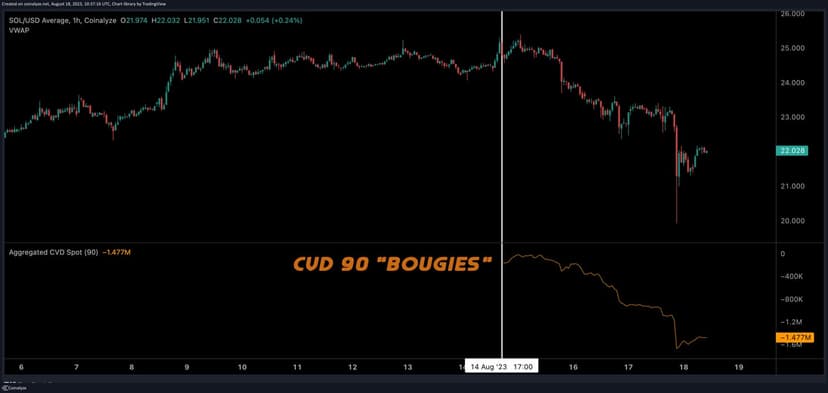
For any trader, this is a real asset. If the CVD line slopes down, it means there are more active sellers because demand for the asset is falling. This is generally a sell signal, and the trader should look for sell signals.
Conversely, if the CVD curve is rising, it means there’s more demand for the asset.
When Can the CVD Help You Make the Difference?!
The CVD, as it is, sums up the activity of market participants. By highlighting the relationship between buyers and sellers in a space plagued by market manipulation, traders gain a head start.
Be careful, though: the indicator is well suited to scalping and day trading. It will be counter-intuitive to use this indicator for swing trading.
Often, the number of buy and sell orders is balanced on higher timeframes, and using the CVD indicator on those timeframes might offer no actionable value to traders.
For optimal results, it’s recommended to enable the CVD indicator on timeframes of 5 to 30 minutes.
Interpreting the Cumulative Volume Delta
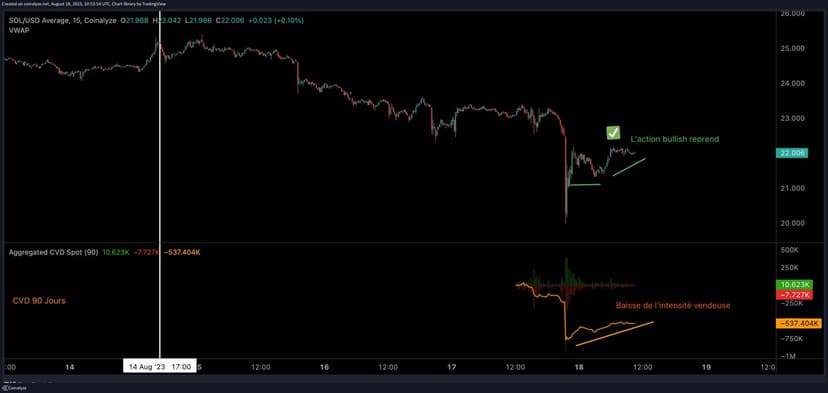
Over a (limited) timeframe, you can see an imbalance tilting toward BTC buyers after watching a large imbalance on the sell side get absorbed. From that point, you can see the CVD curve turn back up. In this example, there was a really nice long scalp to take… For a moment, buyers clearly took back the upper hand!
Weakening and Divergence: How I Read the CVD, on Video
In this video, I go over three indicators that don’t get talked about much and that I use every day. The first chapter covers the CVD: what I look at on it, and what it produced on a real trade.

Aggressive Orders, Passive Orders: What Delta Really Measures
There are two ways to enter a market. Passively, by placing an order in the book and waiting for someone to fill it. Or aggressively, by going after the liquidity already sitting in the orderbook — that’s the aggressive order, the one that pays the taker fee.
A stop loss that triggers is an aggressive order. So is a breakout trade: you can’t wait, you take what’s available. And that’s exactly what delta counts: buys at market minus sells at market. So the CVD doesn’t tell you what participants are displaying, it tells you what they were willing to pay to execute.
1. The Weakening of the Delta
This is the first of the two things I look at. Price prints equal highs — a clean range, nothing alarming to the naked eye — but on the CVD, the highs get progressively lower. Translation: it takes less and less buying aggression to bring price back to the same spot. The pressure is running out.
2. The Divergence of the Delta
The mirror image of the previous one. Two equal lows on price, but progressively higher lows on the CVD: aggressive sellers can no longer push the market as low as before. That’s a bullish divergence.
This read works on any timeframe — in the video I show it on the 15-minute — and it gives good results on Bitcoin. For scalping and day trading, stick to the timeframes mentioned above: 5 to 30 minutes.
Where to Display the CVD: Not on TradingView
Here’s a practical point that trips a lot of people up: the CVD isn’t available on TradingView. Three tools let you display it — Coinalyze, Velo Data and Market Monkey. It’s the most accessible entry point into order flow logic.
A Real Case: My Counter-Trend Short on XRP
The example I share in the video is a short on XRP, taken counter-trend and sent to my VIP channels. The setup: price kept printing higher and higher highs… while the CVD stayed flat. Nobody was backing the rally at market — exactly the signal described above.
To go further with this kind of read, join the free Captain Trading space: with a simple account, you get the daily plan in your trading journal, decoded COT reports, lives and their replays, and the community help room built right into your dashboard — you ask your question in your language and we answer in your language! It’s all free. If you’d like to support us, open an account with one of our partner platforms through the Cashback page: 5% of your trading fees are yours for good, and 10 to 20% in the months when your volume justifies it — that’s what allows us to keep going.
And When It Doesn’t Work
Let’s be honest about it: it doesn’t always work. I took another short based on a CVD signal, and it blew up afterward. The read was clean; the trade was a loser.
No single technical indicator gives you the Holy Grail. The CVD tells you who’s aggressive; it doesn’t tell you where the levels are, or how long the market spent at that price. That’s why it’s read alongside the Market Profile TPO and the VWAP: it’s their synergy that counts, never the indicator taken on its own.
Finding Confluence with Other Indicators
A quick reminder: an indicator read on its own has no value!
So the best approach is to combine the CVD with other indicators before making a decision that can actually make sense. For example, you can use the CVD with stochastic indicators.
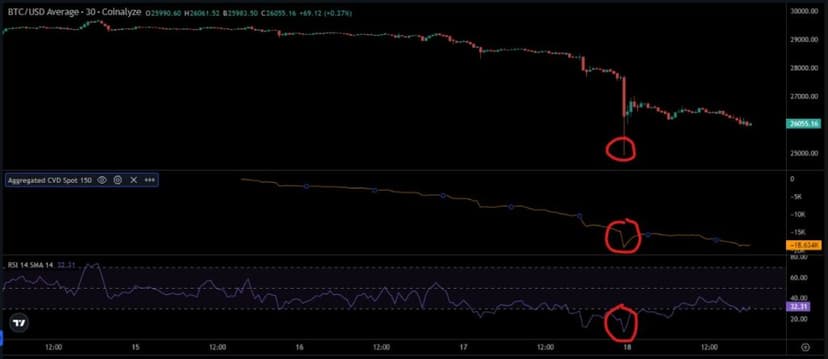
But the choice is yours. There are thousands of indicators to choose from. Personally, I’ve gotten into the habit of comparing it with the RSI. This gives fairly reliable sell and buy signals when I add them to my Price Action analysis.
Building combinations will let you filter out the “noise” of the financial markets you’re interested in!
Frequently Asked Questions About the CVD
What Is the CVD in Trading?
The CVD, short for Cumulative Volume Delta, is a volume indicator that accumulates the delta — buy volume at market minus sell volume at market — candle after candle, from a starting point you choose. A rising curve signals that aggressive buyers are in control, a falling curve that sellers have the upper hand, and a flat curve a market with no clear winner. You then compare it with the shape of price to spot a weakening or a divergence of the delta.
Is the CVD Available on TradingView?
No. To display it, you need a specialized tool: Coinalyze — free, and the one I cover in detail above — Velo Data, or Market Monkey. That’s the main barrier to its adoption: the indicator doesn’t show up where most traders have their habits.
What’s the Difference Between Weakening and Divergence of the Delta?
Both compare the same thing — the shape of price against the shape of the CVD — but in opposite directions. Weakening: equal highs on price, progressively lower highs on the CVD, buying pressure running out. Bullish divergence: equal lows on price, progressively higher lows on the CVD, selling pressure running out.
Does the CVD Work Every Time?
No, and you shouldn’t expect it to. The XRP short shown in the video worked out; another short taken on a CVD signal blew up afterward. No single technical indicator gives you the Holy Grail: the CVD is there to confirm or invalidate a scenario built elsewhere, never to replace it.
Cumulative Volume Delta (CVD): Conclusion and Verdict
It’s essential to understand how your indicators work in order to interpret them. The same goes for the CVD — there’s no secret to it!
When the market is rising, the CVD increases and the line shows a positive slope.
Conversely, a falling CVD means sellers are in control, which the line will show with a negative slope.
When it’s flat, the market is probably in an accumulation or distribution phase. That means neither buyers nor sellers are in control of the situation.
In that case, it’s better to stay away from this data until the CVD shows a significant change. When you have this setup in front of you, it’s better to favor another approach.
As a reminder, the Cumulative Volume Delta can be found on Coinalyze and if you like this tool, I invite you to check out the guide I wrote to help you get to grips with Coinalyze !
Every guide here is free. Browse the full course and join a community of traders who share ideas every day.