In this quick tutorial, I’ll introduce you to the concept of the funding rate. It’s one of the high-value technical indicators in my toolkit, right alongside Open Interest and the Chop Index. That’s exactly why I had to share a few insights on the topic with you!
So here’s a brand-new trading & crypto course made freely available to you!
Perpetual Contracts: Definition
Let’s first define what a “Perpetual Swap” is. It’s really just a futures contract with no expiration date, plain and simple. They’re also called open-ended contracts: no deadline to beat in order to be proven right!
“Perps” mimic spot trading as closely as possible with the added benefit of being able to use leverage without collateral constraints.
Funding Rate: Definition
The “funding rate” is the rate at which longs pay shorts, when funding is positive.
Conversely, it’s the rate at which shorts pay longs, when funding is negative. So when funding is negative — which is fairly rare on bitcoin — you get paid to be a buyer.
This mechanism was designed to keep the perp in lockstep with the asset (or assets) it “mimics”.
What “Funding Rate” Means
In French, “funding” literally translates to “financement” (financing), but in a trading context the proper term is a funding rate.
Funding Rate: Interpretation
When funding on the futures is positive, it means a “premium” must be paid on top of the spot index price. Longs therefore pay shorts. This is the usual situation.
If futures traders are especially bullish and start buying en masse, the “premium” will rise.
Premium = actual futures price – minus the index price at that same moment.
Funding will rise as well. This implies that holding longs will become more expensive!
That’s why it becomes more worthwhile to trade based on the premium.
The higher the premium, the larger the funding, which reflects how aggressively market participants are positioning long with leverage.
When funding is negative, it means trading the futures is cheaper than trading spot! Shorts therefore pay longs.
A Practical Case
For example, if long holders get liquidated in a cascade, the massive selling can push the futures price below the spot index price, and the premium then turns negative.
The opposite can also happen when futures traders are bearish and dump their perps en masse. That said, bearish traders aren’t always the catalyst behind negative funding.
For instance, if spot buyers are bullish, a more or less significant premium can appear on the futures. That too would give us negative funding.
When it comes to shorts, funding is a mechanism that keeps a perp index as close as possible to its true reference index — in other words, to the spot price.
When funding is positive, as is most often the case, the futures trade “at a premium” relative to the index. This means there’s a positive difference between the real index and the cost of the futures. That difference is called the Premium!
When funding is negative, the futures trade “at a discount”, meaning there’s a negative difference between the futures and the real index. That difference is called the Discount.
When funding gets too extreme, whether positive or negative, it reflects the trend traders are projecting. In some cases, it can also reflect just how bullish spot buyers are.
Practical Example and Interpretations
Perpetual contracts differ from standard futures because there’s no expiration or rollover mechanism.
Which raises the following question: how and why do perp contracts generally trade in line with the spot markets?
The Answer: Funding.
It’s a built-in arbitrage mechanism designed to incentivize traders to keep these instruments (and more specifically their prices) in sync with one another.
For this example, let’s assume the perp is trading well above the spot index price and that the funding rate is rising.
Two things happen:
1. It becomes more expensive for holders of long positions to keep them open (negative incentive).
2. Traders can buy spot, sell the perp, and collect the funding with minimal directional exposure (positive incentive).
The larger the difference between the perp price and the spot price, the higher the funding rate.
The more these instruments drift apart from each other, the stronger the incentive to arbitrage the difference.
To be perfectly clear, funding is primarily a product of the difference between [the perp price] and [the spot index price].
I’ll also reiterate an important point: if funding is at its baseline and/or there’s no meaningful divergence between price, funding, and time, you’re unlikely to find an attractive setup.
Funding is part of a series of complementary technical indicators that become interesting from a contextual standpoint when “something doesn’t add up”.
Other Scenarios
Scenario 1: Funding sinks deeper into negative territory as price rises.
Interpretation: Perp sellers are “in disbelief” and aren’t following the move AND/OR spot traders are aggressive buyers (especially if other contextual clues are present, e.g. OI on perp contracts is rising, spot volumes and CVD are leading, etc.)
Scenario 2: Funding keeps climbing while price falls.
Interpretation: Perp dip buyers are “in disbelief” and aren’t following the move AND/OR spot traders are in aggressive-seller mode. This is potentially bearish (especially if other contextual clues are present, e.g. perp open interest rising, spot volumes and CVD rising, etc.)
Scenario 3: Large negative funding, but price is moving up or stalling/not falling.
Interpretation : Perp shorts are aggressive but aren’t being rewarded for it. This is potentially bullish (especially if other contextual clues are present, e.g. price reaching a key support).
Scenario 4: Large positive funding, but price is moving down or stalling/not moving up.
Interpretation : The perp’s long positions are aggressive but aren’t being rewarded. This is potentially bearish (especially if other contextual clues are present, e.g. price reaching a key resistance).
Cases Where Funding Is Misinterpreted
Really, we come back here to some very important fundamental principles:
1. Who (if anyone) is being aggressive?
2. Is that aggression being rewarded?
Finally, it’s also important to understand not only what funding rates are and their implications, but also how they came about.
Three particular examples come to mind where funding rates are most often misread.
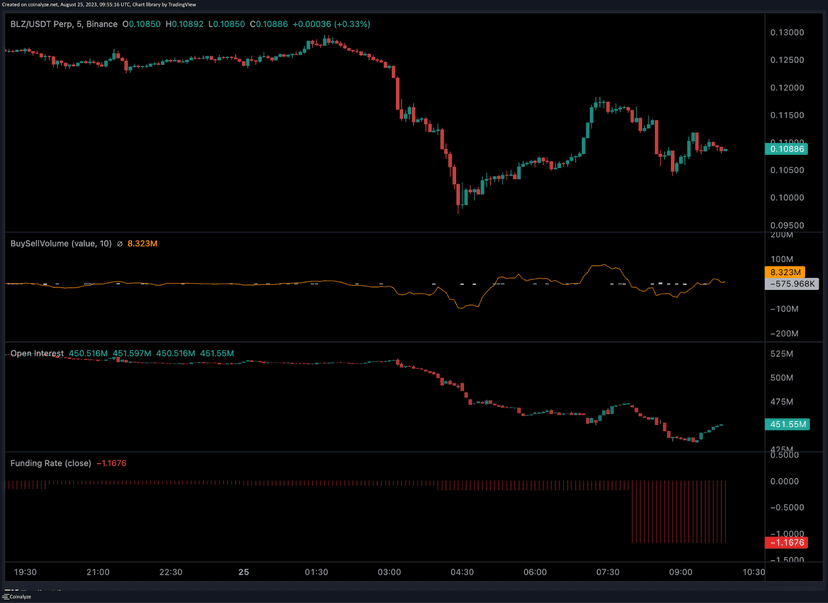
1. A negative funding rate after a massive wave of liquidations.
As we’ve seen, funding reflects the difference between the perp price and the index price.
Perps carry more leverage than the spot assets that typically make up the index. As a result, when there’s a large number of liquidations in the perp, those liquidations and the disorderly unwinds exacerbate the magnitude of the move.
Perps generally become more dislocated than spot at the extremes, so they naturally end up trading at a discount relative to the index.
Consequently, negative funding after a wipeout doesn’t necessarily mean the market is short from the bottom. It’s simply a reflection of the fact that perps were hit harder than spot because of the leverage they offer.
2. “Spot premium” and negative funding
The spot premium — when an asset’s spot price consistently trades higher than the perp price or the futures price of an asset — can provide useful signals.
For example, during the 2021 bull run, it was common to see spot venues such as Coinbase consistently trading at a higher price than the futures, with those contracts at a discount during the US session.
You could reasonably read this as a reflection of risk appetite and more aggressive buyers in the spot market, which is generally a good sign.
However, this same argument was made many times during the decline from around the point BTC fell below $50K, and it didn’t really pan out.
Mechanically, spot was leading the selling. From there, the perps followed, got liquidated, and moved more aggressively than spot.
Ultimately, the perps ended up below spot, which is what gives us the “spot premium”.
It’s the same spot premium in form, but completely different in substance and context.
If you intend to use the spot premium as an argument for spot demand, make sure you have other arguments supporting the existence of real demand in the market. Find points of confluence; a single indicator is worth nothing on its own.
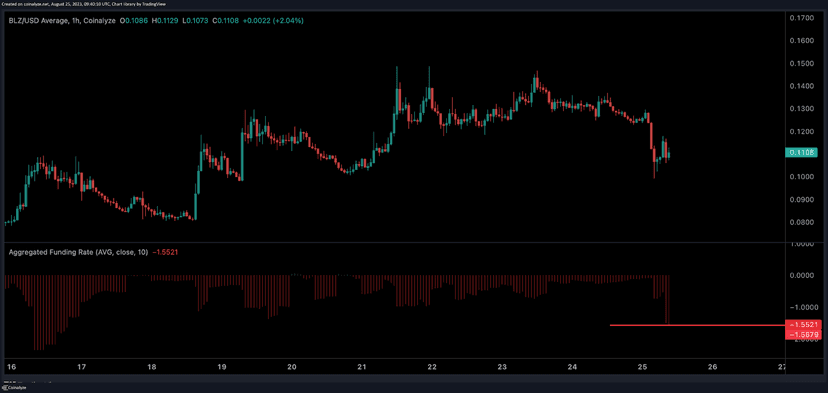
3. Maxed-out funding on altcoins, bordering on absurd = imminent squeeze.
This pattern is especially relevant in the second half of 2023.
It plays out as follows:
First, you notice a nice run-up in price. Funding is extremely negative and longs pile in for the continuation/short squeeze because of the negative funding rate
Then spot gets hammered and funding normalizes.
When it comes specifically to low-cap outliers, I’d be skeptical about reading too much into funding data, since it tends to be “gamed” more often than not. The signals tend to be cleaner on more liquid, higher-cap assets.
More generally, funding alone isn’t always a convincing argument for a forced sell-off.
Finally, even in this case, positive funding can normalize through occasional closing/buying of perps, and negative funding can normalize through occasional buying/selling of perps – without there necessarily being a spectacular squeeze.
The Captain’s Take on Funding
Like any indicator, taken on its own it doesn’t really mean much. It remains a useful indicator if you can cross-reference it with others.
Funding and Open Interest Course
Finally, if you want to learn more about funding and where to find this essential indicator, check out my tutorial on YouTube. It’s already more than 2 years old, but it’s one of my most-watched tutorials!

Every guide here is free. Browse the full course and join a community of traders who share ideas every day.