My goal in this article is to introduce you to Wyckoff and his method, because to me he's a genuine role model. Before we begin, I'll add that mastering Price Action analysis is incredibly useful when it comes to finding points of confluence with the method Wyckoff developed. So here is a brand-new free crypto trading course for you!
As a reminder, my trading course, available for free on YouTube, is essentially built around Price Action analysis.
Put My Courses into Practice with Technical Analysis: TradingView!
I'd recommend everyone start right here with the theory Wyckoff laid out, but if you're the impatient type… here's a preview with my tutorial on Fibonacci retracements! Careful, though: Fibo isn't a topic tied purely to Price Action. That said, Fibo and P.A. pair perfectly in my interpretations, and their confluence lets me find excellent entry and exit points every single week!

Now let's get down to business: Who is Wyckoff?!
This introduction to the man himself will help you pin down the need he was trying to address! Understanding the context this gentleman operated in helped me grasp the parallels between his situation as a trader and my own. So I'd encourage you to do the same.
Richard Demille Wyckoff (1873–1934) was one of the pioneers of technical analysis in the stock markets. As such, he's actually regarded as one of the 5 titans of technical analysis, alongside Dow, Gann, Elliott, and Merrill.
If you want to dig into another of these five titans' work, my Elliott Wave Theory guide covers the wave patterns he built his own analysis on.
At 15 he landed his first job at a New York broker, and at 20 he founded his first company. He also founded "The Magazine of Wall Street," which had 200,000 subscribers at its peak — a staggering number for the time.
Wyckoff was an analyst hungry for market knowledge and understanding. He was also very active as a trader. In his day, he was able to observe some legendary operators such as JP Morgan and Jesse Livermore. From his observations, along with his many interviews and conversations, Wyckoff "codified" the best practices of Livermore and many others in order to distill a genuine methodology made up of laws, principles, and other techniques tied to money management and psychology.
We operate in markets that are often irrational, and an investor who wants to keep calm and clear-headed will very often be frustrated in a volatile market. It's also easy to get lost when trying to pick up new methods for anticipating price.
Wyckoff championed a return to the fundamentals! And he never strayed an inch from it. Nearly 100 years ago, a trader was already promising to reveal "the real rules of the game." To this day, his method remains a classic thanks to its timeless consistency. He was, for example, the very first to show that markets respond above all to the law of supply and demand. That law applies today to every competitive market.
Wyckoff published his first technical analysis method in 1908. From 1911 onward, he sent out his forecasts on a weekly basis, using price, volume, and his own analysis of the markets.
Wyckoff completely disagreed with the analysts who used charts to time their entries and exits. He was convinced that "the methodologies tied to technical analysis are not an exact science. The price of a stock is set by the minds of men."
According to Wyckoff, purely technical — even mechanical — analysis cannot compete with experience combined with a sharp sense of judgment.
He routinely ignored financial reports, product launches, rumors, traders' "tricks," and so on. He also held real contempt for the "junk theories peddled to the boards of big companies and in popular books about the markets."
I imagine this rings true for many of you reading this article…
These days, we're all confronted with junk analyses and tips on social media.
Introduction to the Wyckoff Method
Wyckoff was convinced that an analyst must become a true detective, whose job is to uncover what lies behind the swings in price and volume. Wyckoff was a genuine market psychologist, reading the human motivation that fuels the markets.
He was also a general who planned his trade entries at the perfect moment!
Wyckoff had a simple method with simple objectives, and that's another principle I apply every single day!
The goals of this method are to make optimal use of your investment capital by:
1. Selecting only the assets likely to move the fastest and the furthest, in a bull market as well as a bear market.
2. Limiting losses and maximizing profits
Wyckoff's popularity as an analyst and the impact of his newsletters grew considerably.
After 40 years in the markets, he kept learning a method fundamentally based on the law of supply and demand.
"When demand for an asset exceeds its supply, the price rises — and vice versa." Simple, isn't it?!
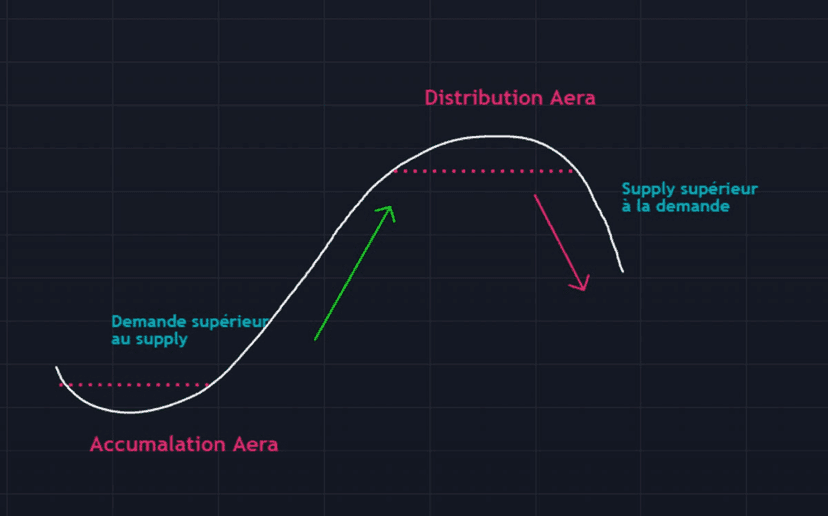
Wyckoff's schematics show the variations in price and volume, and how they relate to each other over time.
According to his method, the only things you should use on your charts are price and volume. You need nothing else — or almost nothing…
The goal is to work out how the market and individual players will react and interact as price structures shift — in other words, with supply and demand.
You're hunting for key points!
For example, the last high of a bull market or the last low of a bear market?
A Wyckoffian analyst's job is to spot the peaks and, from there, anticipate what the intermediate moves will be.
For our dear Wyckoff, the theory is guided by the fact that every price move is made up of waves of buying and selling that will continue for as long as the asset still interests someone.
When one wave runs out of steam, the opposite one begins!
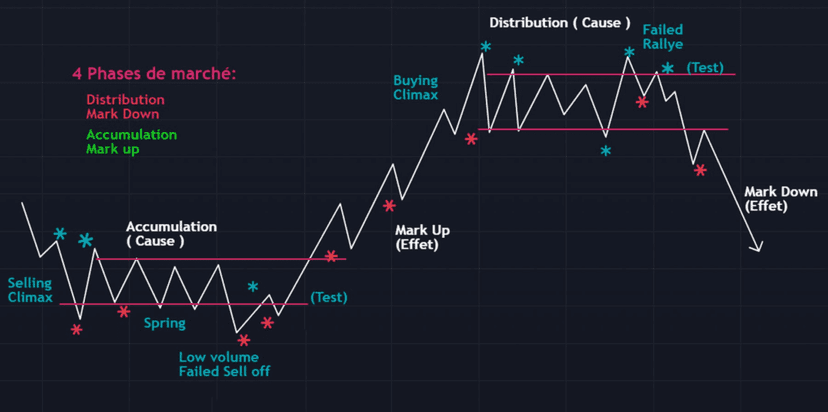
The small daily waves build up and combine into weekly waves. If a wave is significant, Wyckoff acts in harmony with it.
At the height of his craft, Wyckoff used point and figure charts, especially during buy and sell tests.
It's something we don't really use anymore. Personally, I don't venture into P&F unless the situation is truly unusual.
In my experience, I find the occasions to use them fairly rare these days.
By the way, point and figure charts are mainly used to define:
- the direction of price
- the best entry, exit, or invalidation points
- the stop-losses.
Here's the thing: once it clicks, you'll understand that Wyckoff's method gets straight to the point with a simple approach.
This method lets you trade less and earn more — I can confirm it: price and volume are enough to be effective.
I. The Composite Operator According to Wyckoff?
To carry this article forward, I was thinking of starting with a discussion about accumulation.
That said, it's essential to understand the role of the operators in Wyckoff's methodology (CO: Composite Operator, "the whales," and other institutional players in crypto)
The reason is simple: the operators are hiding behind every move, positive or negative. Once you've understood the role of the COs, it becomes far easier to understand accumulation and redistribution moves from a Wyckoffian standpoint.
…All the fluctuations of the markets and of their instruments should be studied as if they were the result of the actions of a single person. Let's call him the Composite Man, who, in theory, sits behind the scenes and manipulates the market to your detriment if you haven't figured out his game, and manipulates it to your great profit once you've understood it all.
As we now know, one of Wyckoff's ideals was to reveal the real reasons behind market fluctuations.
In fact, it was when Wyckoff realized this that groups of more seasoned, better-informed traders came into view.
These trading titans have the ability to control the market by outright influencing prices. The market is a dance floor, and they're the ones running the playlist. They are the Composite Operators!
In reality, the COs are a kind of "useful fiction," because it's a concept that genuinely makes the markets easier to understand. As someone who appreciates boiling theories down, that suits me perfectly!
The CO is a bit like the order book of a group of super-traders all operating at the same time.
Wyckoffians prefer to explain their actions and motivations as if they were one single market participant.
Since I apply the Wyckoffian method day in and day out, it's my responsibility to work out the CO's actions from the activity we can read on the charts.
Wyckoff was very used to reading the "order books" to understand the motivations behind major financial operations; he could track them every step of the way!
II. What Is an Accumulation Phase According to Wyckoff?
Definition of an accumulation phase according to Wyckoff:
Accumulation is a more specific process than people imagine, and its subtleties aren't always obvious.
Put simply, it's the accumulation… of an asset at the price the buyer wants, over a well-defined period of time.
Typically, when an accumulation phase begins, it puts an end to a downtrend because the CO takes massive long positions in order to absorb as many assets as possible at the optimal price, and does so spread out over time, with many split orders.
It usually begins when a wave of panic selling and heavy selling comes to a halt.
The idea behind an accumulation phase, and the range it involves, is that it discourages traders who need a clear trend to act. That triggers selling and fresh dips — opportunities for the Composite Operator.
One of the goals of the Wyckoff method is to optimize your timing when anticipating a move that offers a favorable win/loss ratio.
A range is a phase in which the previous trend is halted because there is a relative balance between supply and demand.
Institutions and other major market operators are getting ready for their next campaign, whether it's a buying or a selling one!
In the first case (if a bull move is coming) they accumulate; in the second (if a bear move is coming) they distribute.
A Few Accumulation Schematics According to Wyckoff
To find the patterns for the Cup & Handle, the Head & Shoulders, the Double Bottom, and the Ascending or Descending Wedge, I recommend my free course on trading patterns
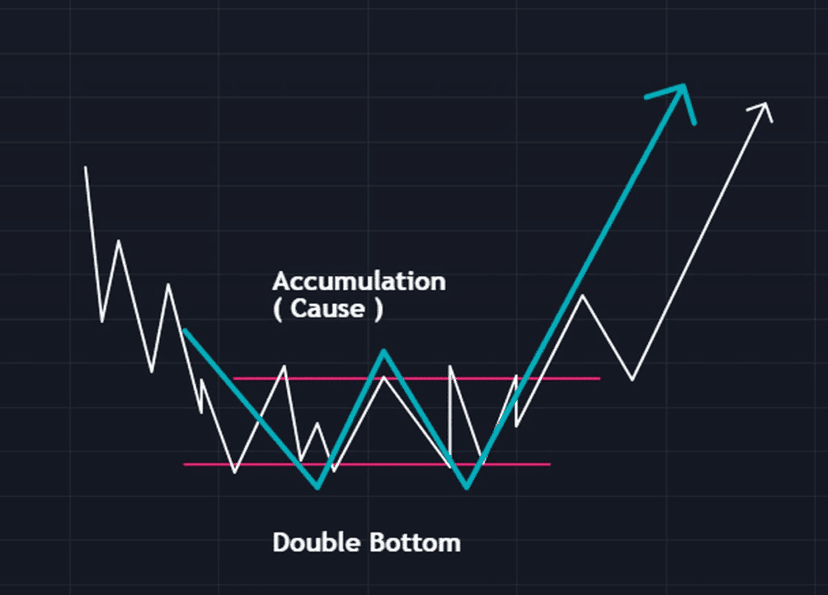
How you trade a range will depend on your style and your specialties!
If you're a Swing specialist, you'll probably want to seize the opportunities and moves between the key zones.
If you're a scalper, the boundaries of the range are set and you can act without any trouble, and so on.
Now let's clear up a few things that are usually forgotten when discussing an accumulation process:
The accumulation phase occurs when a balance is reached in terms of price. Generally, accumulation phases become more obvious on the 12H timeframe.
Volume is a key indicator of accumulation (and of distribution). A Wyckoffian schematic with no volume isn't one at all!
After a downtrend, we'll look for signs of accumulation or redistribution.
After an uptrend, we'll look for signs of distribution or re-accumulation.
An accumulation phase meets several criteria that must line up to lend a range credibility.
Here Are 2 Theoretical Examples of Accumulation According to Wyckoff
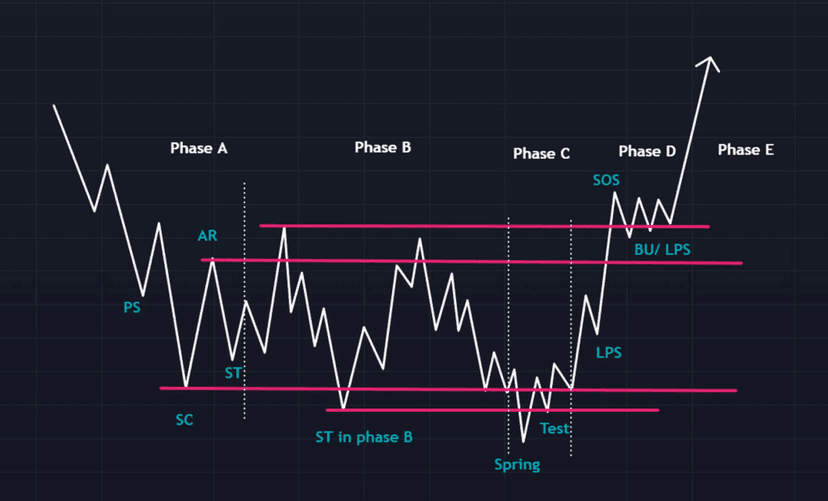
Here, we're looking at a classic accumulation schematic. This visual is perfect for analyzing a potential range.
Obviously, this schematic is theoretical, and you'll need experience to spot this kind of structure. Schematics aren't exact replicas…
Schematics like this exist to demonstrate a coherent structure. As a chartist, it'll be up to you to interpret and analyze how price develops (price action).
Wyckoff may not be familiar to you. That's why, to help you understand this structure, you'll find the definitions of the various key points that make up the charts above.
In the first example of an accumulation cycle according to Wyckoff, we test the liquidity below the low of the STs.
In the one below, we visit the bottom of the range at the ST level, without actually testing the liquidity.
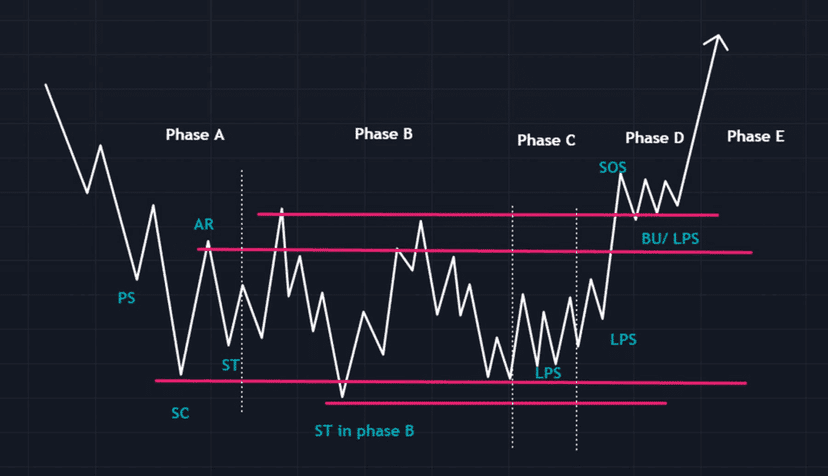
PS — Preliminary Support.
This is the price zone where buying starts to take over after a prolonged downward move. Volume rises, suggesting that the downward move is nearing its end.
SC — selling climax
This is the point where selling pressure reaches its peak and where "panic" — or simply massive — selling is absorbed by experienced traders at or near a bottom. Often, the price ends up closing well above the low, showing that there's still strong appetite.
AR — Automatic Rally
Selling pressure has dropped considerably.
A wave of buying pushes the price back up easily, fueled by the hedging that reinforces confidence in long positions. The peak of this rally will help you define the upper boundary of an accumulation phase within this range.
ST — secondary test ( the minor test ) the second minor retest
This is the phase where price revisits the Selling Climax zones to test supply and demand at various levels.
If a bottom is confirmed, volume and volatility will be significantly reduced as the market approaches the SC zone. It's common to see many minor tests after an SC. Might we currently be in this phase as of June 9, 2021? Only time will tell!
Test
The major operators are always testing the market and supply during a Range ( STs and bounces ) and at the key zones during price increases.
If supply is particularly heavy at the test zones, it means the market isn't yet ready to see an uptrend again.
A bounce is generally followed by one or more tests. A successful test is one that suggests price will keep rising. Typically you'll spot it as a higher low on lower volume. Indeed, supply is shrinking, so heavy volume is no longer needed to push higher…
SOS — Sign Of Strength
Here we notice a rise in price and a genuine expansion on relatively heavy volume. An SOS most often occurs following a bounce.
LPS — last point of support
This is the low at which we'll see a reaction or a pullback after the SOS.
The return to an LPS suggests a pullback to a support that was previously a resistance, on lower volume and volatility. You may spot several LPSs, despite how precise the term sounds.
BU — "back-up".
This term is actually shorthand for a colorful metaphor. Robert Evans, one of the leading teachers of the Wyckoff method. According to him, an SOS is like jumping from one bank of a creek to the other. The return to the water ( back up to the creek ) represents both short-term profit taking and an additional test of the resistance zone.
The back-up is a structural element that commonly precedes a more significant rise in price, and it can take different forms. It might be a simple pullback or a new range at higher levels.
Whatever the schematics, what you need to look for are the signs of accumulation. The key elements to consider are:
- Is demand volume increasing? Is the reaction following the bargain prices positive?
- Do we notice an obvious "climax" that lets us mark the start of a range?
- Do we see an automatic reaction?
- Have we noticed any bounces ( a move below the SC or the TR) and what was the market's response?
- The minimum timeframe to frame a range is normally 12H. Since the crypto market moves very fast, especially lately, I play around with the 4H
Here's a BTC range suggesting accumulation, so you can see the key points on a practical, current example!
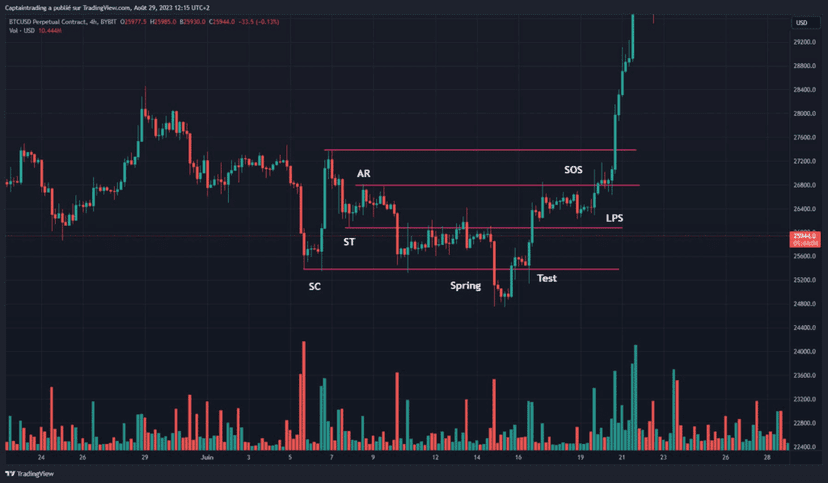
Misconceptions About an Accumulation Phase
There are many false ideas floating around about the concept of accumulation in general. Today, we're going to try to clear up a few of them:
"The downtrend has stopped, volatility is low, and the price is stable — it must be an accumulation phase…"
WRONG! When you're in a downtrend, the first thing to think about is redistribution, because that's the most common case. No — just because the drop is over doesn't mean you're in an accumulation phase.
You can spot this just before the accumulation phase highlighted in the BTC example shown earlier. Here's another one:
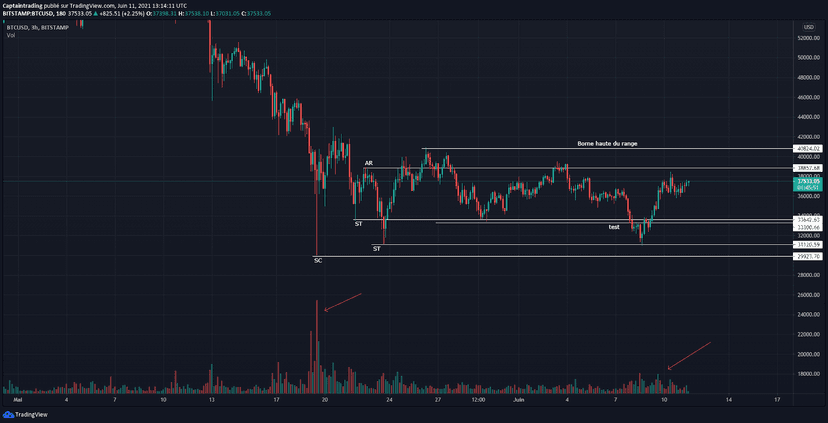
It's natural to think that if the downtrend is broken and the supports are tested again, you've got the obvious hallmarks of accumulation. But that's simply wrong. It could very well be the phase leading up to the SC!
That's the phase where sellers offload again at a higher price before dropping into the Selling Climax, and only then does the accumulation phase finally begin. Don't be fooled by the easy assumption that every downtrend leads to accumulation.
"This altcoin bounced off a bottom — it must be the start of an accumulation…"
Incorrect, same problem… Just because an alt bounced off a bottom doesn't mean it's the start of an accumulation phase. What tells you it isn't another redistribution?!
Don't forget that an accumulation phase meets many criteria. Any single one of them, taken in isolation, is worthless.
"Look at this H1 chart, you can clearly see the accumulation"
Once again… this is WRONG, and consider it a genuine warning: accumulation doesn't happen over a few hours, but over at least several days — even several weeks. That said, the re-accumulation process we'll cover in Part 3 of the Wyckoff series can happen in a few hours, or even a few minutes, and be super profitable for anyone who knows how to position themselves!
III The Distribution Phase According to Wyckoff
To understand the Distribution phase, from here on you have 2 choices!
The very theoretical written course a little further down, or one of our latest tutorials on YouTube!

Just like an accumulation phase, distribution phases are a very specific process.
Put simply, it's the phase where the aim is to sell an asset at the best price over a certain period of time.
It's the perfect opposite of the accumulation phase, where participants seek to secure their buys at the lowest price.
As a trader, it's generally easier to trade a rising market. However, knowing how to recognize a market in a downtrend may one day help you make the most of it. This is considered harder, and rest assured that once you've got the basics down, it's experience that will make the difference.
One of Wyckoff's goals is to optimize your timing when establishing positions in anticipation, with a good RR ( Risk/Reward = risk vs. potential reward )
Here's how the famous "Composite Operator" ( see Part 2 ), begins the slow process of "distributing" its holdings…
It starts with the halt of the "Buying Climax" ( BC = the peak of demand ), the exact opposite of the Selling Climax we saw earlier.
A Range is a space in which a trend is halted because there is a relative balance between supply and demand.
Institutions and other major operators prepare for the next Bear Market by distributing their positions during the ranges.
In an accumulation phase, as in any other range, your trades depend on your style!
If you swing trade, you'll be more focused on the key moments of a specific phase. If you're a scalper, you have your well-defined channels and you can operate comfortably within them.
First, let's clear up a few points that are usually overlooked when discussing distribution phases:
- A distribution phase begins when a price balance is found following an uptrend, when price stabilizes and starts to form a range.
- A distribution phase is, in theory, noticeable on the 12H timeframe and above. However, volatile markets can absolutely experience micro distribution phases. So you can see the signs on lower timeframes as well.
- Volume is a key indicator of accumulation and distribution phases. A Wyckoffian always keeps a close eye on volume.
- After an uptrend, you need to watch for signs of distribution OR re-accumulation.
A distribution phase meets many criteria to truly be considered one, and for the range to show us relative stability.
Here are various distribution schematics offering useful clues for analyzing potential ranges. Like any theoretical approach, these schematics aren't meant to become replicas of reality. Above all, they're there to give you a structure so you can analyze and interpret how Price develops ( Price Action ).
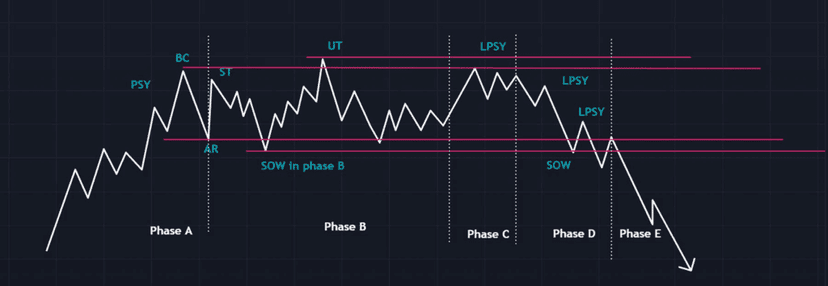
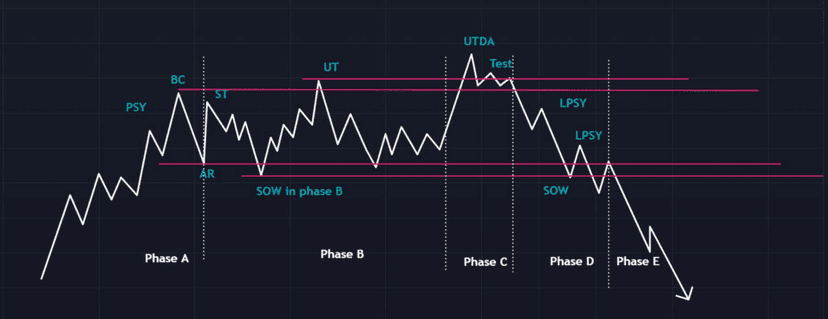
Here are the various key moments you're likely to observe during a genuine distribution phase:
PSY — preliminary supply
This is the moment when the major operators start offloading a large portion of their assets following a strong upward move. Volume and the spread increase, signaling in passing that a trend reversal is possible in the near future.
BC — buying climax
This is the period when buy volume is at its highest. During this stage, we also notice a rise in volume and in the spread. It's the moment when you generally hear the most good news, so that the buying pressure from small wallets can absorb the supply from the major operators without tipping the price over.
AR — Automatic Reaction
We notice a significant drop in demand after its peak, while supply volume holds steady. The trough that follows this move defines the support of the upcoming distribution range.
ST — Secondary Test | The Re-Test
This is the stage where price revisits the BC levels to test demand and supply at high price levels. For a Top to be confirmed, supply volume must be clearly greater than demand. This way, the spread and volume fall as we approach the BC resistance.
A Re-Test can look like an UpThrust (UT), a stage where price moves above the BC resistance and produces new Re-Tests before price quickly returns below the resistance on the close. After a UT, price often tests the lower boundary of the TR
SOW — sign of weakness
It's characterized by a downward move toward the lower boundaries of the TR. This stage generally occurs on relatively high volume and spread.
The AR and the initial SOW(s) indicate a change of trend, since supply is now clearly dominant.
LPSY — last point of supply
After testing the support at an SOW, a feeble rally occurs on a narrow spread, showing that the market will have a very hard time recovering. This inability to grow in a sustained, lasting way is due to weak demand, abundant supply, or — worse — both at once. The LPSY is the moment when demand literally runs dry and where we see the final waves of distribution from the major operators.
UTAD — upthrust after distribution
The UTAD is the move that is the opposite of the spring from the accumulation phase.
It occurs in the final moments of the Range and provides a definitive test of the new demand following a breakout from the range.
A UTAD isn't a mandatory element in a distribution phase. In fact, you'll find one example with a UTAD and another without.
ICE — Here's another concept that isn't "mandatory" but is nonetheless worth mentioning. Imagine you're on a frozen lake, and every time you take a step, the ice (ICE) weakens a little more…
During an accumulation, we draw a rough line across the tops of the range, and each time price touches the resistance line, it weakens. But once price breaks through it, it'll stay stuck above it for quite a while!
For the distribution phase, the same pattern forms but in reverse. We draw a rough line that encompasses the main troughs. Once the support is broken, price will have a hard time climbing back inside.
To put theory into practice, here are the signs of a distribution phase I stay especially alert to. In my view, the key elements to watch are:
- Is supply volume increasing?
- Is there a response trying to keep the price high?
- Do we see a Buying Climax obvious enough to start a range?
- Look at the candlesticks with long wicks; this signals the "safeguarding measures" around price.
- Do we see a hanging man or an evening star forming?
- Do we notice an Automatic Reaction ( AR )?
- Is price falling back on heavy supply volume?
- Have we seen moves below the BC or the TR?
- Forget timeframes below 12H.
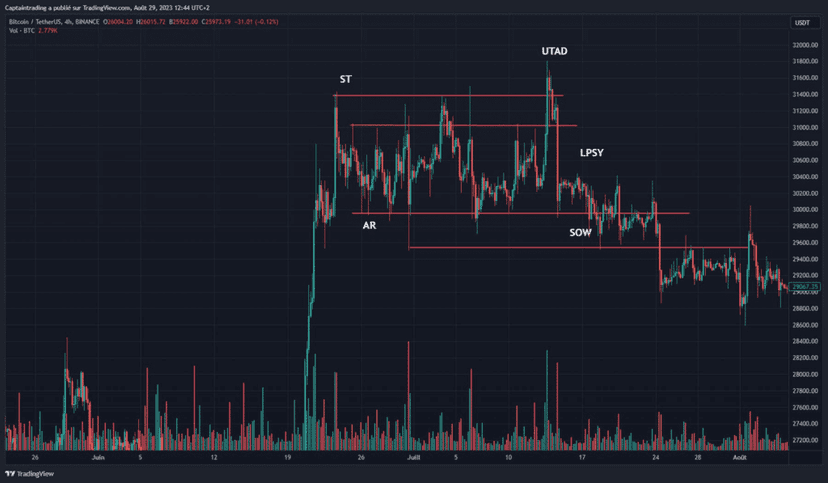
These Traders' Operations in the Stock Markets Follow Cycles
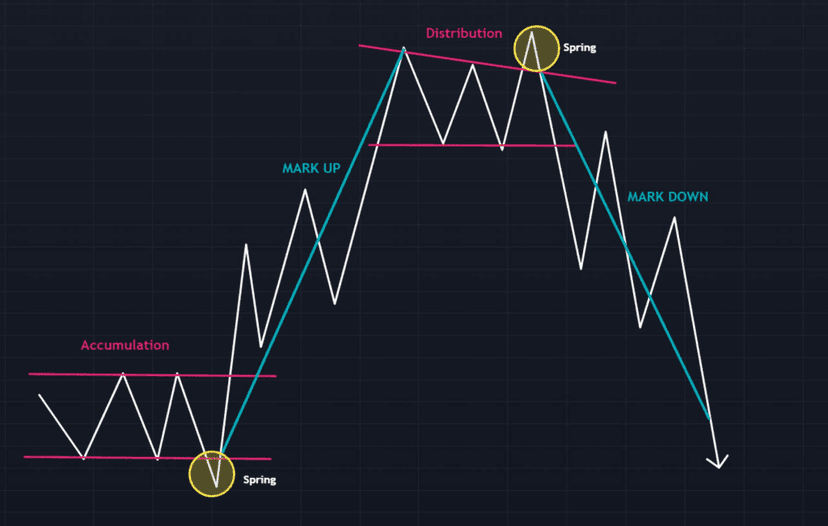
The considerable scale at which the CO's operations are carried out lets it get in as early as possible during accumulation periods. On top of that, the CO doesn't want to be discovered in its decision-making, so as to keep a step ahead.
Its goal at the start of an accumulation phase is to acquire as many securities as possible at the best price — simple and logical so far!
Then the CO needs to "balance" its interventions so as not to drive the price up simply through, say, one massive buy. Accumulation operations can take months in order to smooth out the price and make the most of the bottoms.
Wyckoff concluded that such operations, conducted on a large scale, trigger major rallies following the accumulation phase. The targeted assets move further and for longer than the others…
We also see the opposite behavior when observing redistribution structures. Obviously, the CO will operate so as to sell its assets at the highest possible price. During this process, the CO will also try to hold the price up for as long as possible before its intentions are noticed and trigger a wave of panic whose consequences it would suffer far too quickly.
This is a genuine battlefield on which the "super-traders" fight to grab the best assets! Secrecy in running major campaigns is therefore fundamental.
The activities of the "super-traders" are combed through by the Wyckoffian method. Years of research were needed just to begin glimpsing the CO's operations on the charts.
The method can be rounded out with Sam Fisher's "stealth," but the footprints left on the market cannot be erased!
It's impossible to hide from the Wyckoffians, who simply observe the obvious thanks to 2 key elements:
- Volume
- Price
In Part 1, I already mentioned that these are the only elements I look for on the charts if I'm focusing on a purely Wyckoffian approach.
The CO shows a certain skill in how it operates, and it's not easy to spot when you're starting out; experience is obviously required. What's more, it holds the capital needed to bend the market to its will, especially in the crypto market!
Wyckoff was determined to become an integral part of the Composite Operator, to become like them in his thoughts and actions — and he did!
If you can't beat them, why not join them?
That's the essence of the Wyckoff method and its drive to understand what the "big boys" are doing in order to follow in their footsteps.
By regularly studying the CO's history on the charts, you can begin to think and act in unison with it.
When everything collapses, Wyckoff reads it very simply: it means the CO is either accumulating or redistributing.
My intention is to analyze the traces left by the CO on the markets so I can follow its tracks and take similar trades:
If we observe a redistribution, I sell!
If we observe an accumulation, I buy!
By understanding this simple mechanism and analyzing the CO's traces on the markets, I can start placing my trades while making sure I hold similar positions — with a completely different amount of capital…
According to Wyckoff, "it doesn't matter whether the moves are genuine or artificial; either way, they're the result of buying and selling by the public, by investors, or of artificial buying and selling carried out by major operators." That's the message Wyckoff passes on to every trader.
To Sum Up and Conclude on the Wyckoff Method:
"The Composite Man (operator) conscientiously plans, executes, and closes out his positions."
He entices the public to buy assets once he has already accumulated for a long time! It's a bit like what happens when you hear about BTC on TV… by then it's already too late, and it's time to sell.
You need to analyze and study the charts with the goal of spotting and anticipating the behavior and motivations of the participants who dominate the market!
With practice, you can develop the skills to interpret the motivations hidden in the charts! Wyckoff and his students believe that if you can understand the market's behavior, then you can identify many opportunities early enough to profit from them.
I sincerely hope this deep dive on Wyckoff has been instructive, because on its own it's one of the pillars of my method.
Happy trading, everyone!
Every guide here is free. Browse the full course and join a community of traders who share ideas every day.