This isn’t just another blog post. It isn’t meant to be merely read but to be studied in depth. Indeed, knowing how to draw support and resistance is one of the first things to master when you set out to analyze an asset with the goal of taking a position on it.
Support and resistance are probably the most underrated tool in a trader’s arsenal. What’s more, you can clearly see that beginners dismiss this strictly essential part of learning technical analysis and trading — which is exactly why I created this free course.
I speak from experience, but also because I clearly notice that online … hardly anyone cares about learning how to draw support and resistance!
That said, if you need motivation, know that many successful traders are famous for relying almost entirely on support and resistance. That tells you how important they are … So never neglect them!
Drawing Support and Resistance: Understanding the Basics
Support and resistance can be categorized in 3 ways:
1. a demand or supply zone that suggests entry or exit points.
2. trendlines
3. horizontal lines marking the prices that act as support or resistance.
It’s this last one that we’re going to study today.
Horizontal S/R are one of the pillars of my strategy. I rely far more on flat S/R because they’re far more reactive and nowhere near as subjective as diagonals can be.
Support: Definition
A support marks the price at which buying pressure is greater than selling pressure. It acts as a base from which you generally expect a bounce to the upside.
It’s a key level where demand is simply stronger than supply, so you generally expect the price to rise when this level is reached.
Resistance: Definition
A resistance marks the price at which selling pressure is greater than buying pressure. It acts as a ceiling from which you generally expect a bounce to the downside.
It’s a key level where supply is stronger than demand, so you generally expect the price to fall when this level is reached.
Drawing Support and Resistance: How to Do It
Drawing a Support
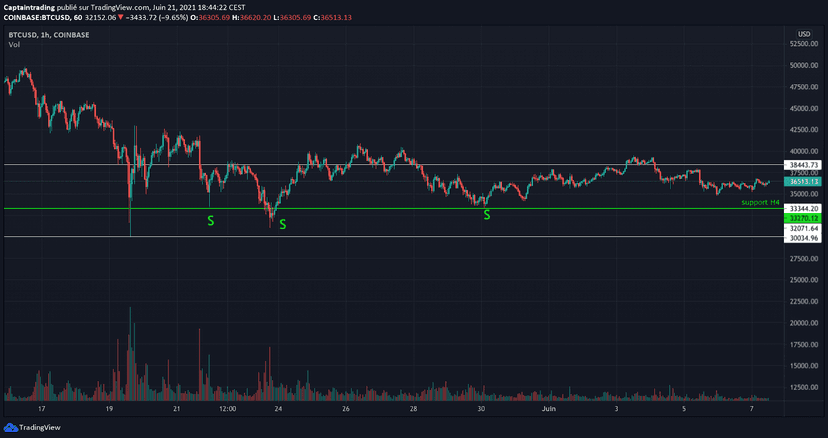
A good starting point is to focus on the timeframe you’re trading. Then try to connect the lows in a logical way, as shown below, while keeping an eye on the supports of the macro timeframes.
I say “logical” because a support should be obvious and easy to spot. There’s no reason to overthink it — a support should be clear!
That said, it’s perfectly acceptable for your support not to be perfect in every respect, because you’re looking for a zone rather than an exact price.
The example below illustrates what I mean when I say a support doesn’t have to be “perfect”. You can clearly see that my support doesn’t line up perfectly with the wicks or the candles, yet it’s still clear.
How to Draw a Resistance
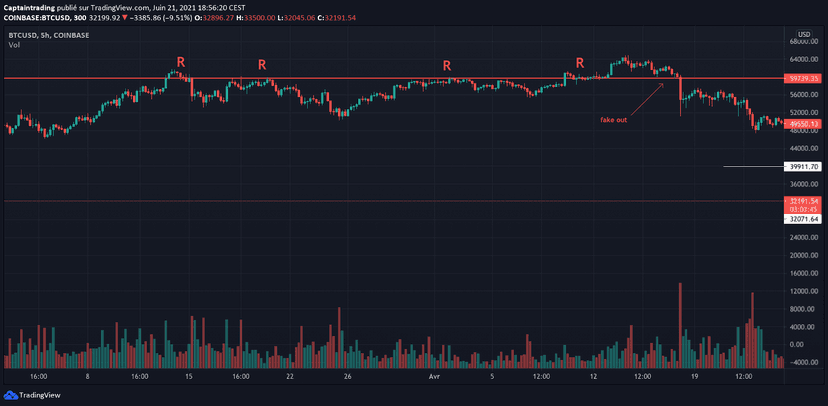
To draw your resistance, just like with your supports, try to connect as many highs as possible on the timeframe you’re trading, and in a “logical” way. Likewise, a resistance should jump out at you!
Resistance: An Illustrated Example
Thanks to this example, you can also spot a great example of a “false breakout” or “fakeout”, which we’ll detail later on.
Breakdowns and Breakouts: Understanding What They Are
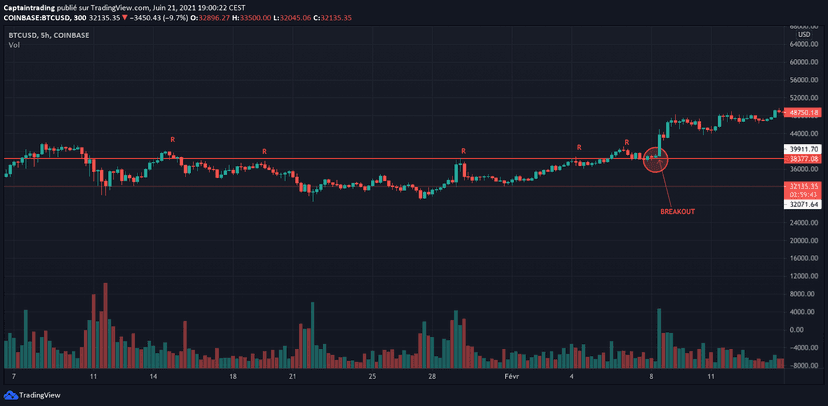
A breakout occurs when a resistance line is tested several times, leading to an increase in demand around that price zone. Once supply is overwhelmed by demand, you get a breakout.
The more a resistance is tested, the weaker it gets.
Here’s an example of a breakout.
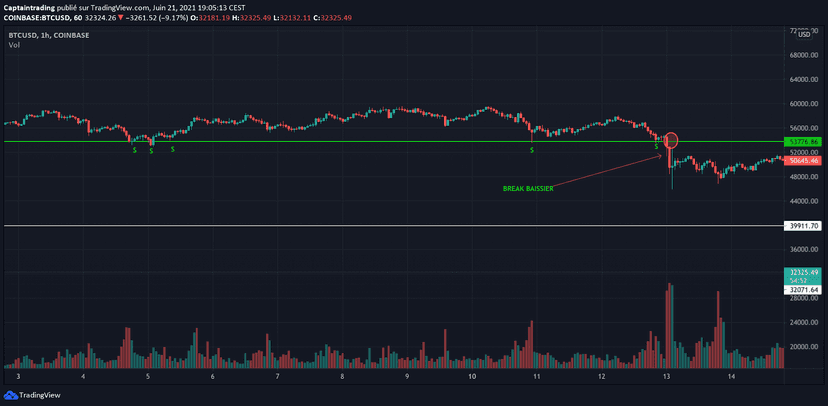
A breakdown (BEARISH BREAK) occurs when a support is tested repeatedly, leading to a growth in supply around that price zone. Once demand is overwhelmed by supply, you get the breakdown.
Here’s an example of a breakdown
What Happens When Support and Resistance Are Broken?
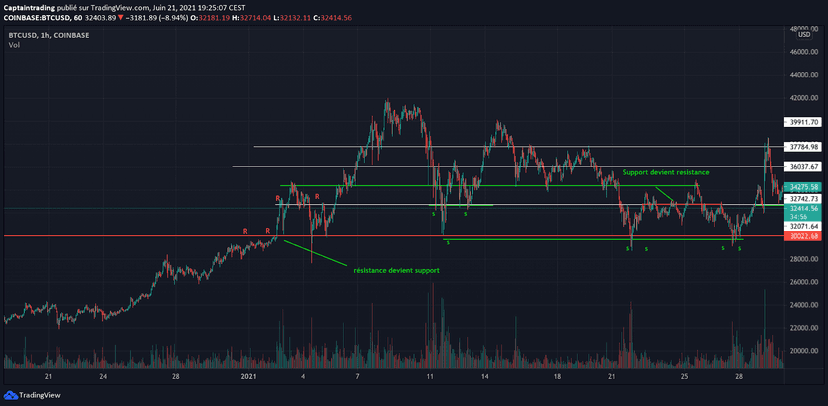
Their nature flips; support becomes resistance and resistance becomes support.
The concept above is crucially important when it comes to understanding and confirming a trend.
When they’re broken, resistances become supports and the cycle repeats until the trend is broken.
Here’s a Concrete Example of Resistance Turned Support
Drawing Support and Resistance: What’s the Point?
Intuitively, you’re tempted to think a support should be used to take long positions when it’s hit and short positions when you visit a resistance zone. And that’s actually the case when you’re in a range!
However, the reality of trading isn’t that simple, and using support and resistance the way suggested above assumes a perfect understanding of the following:
- Breakouts and breakdowns
- fake breakdowns/breakouts
- Retests
- confirmations
- stop-loss hunting
I’ll explain each of these below.
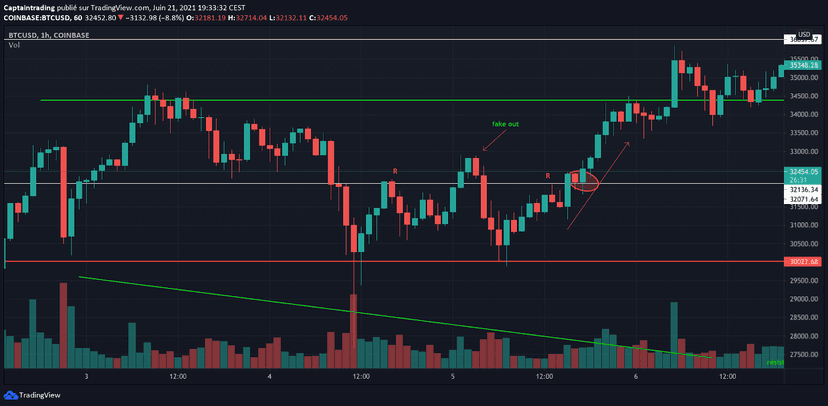
First off; remember that a genuine breakout leads to a bullish rally because of strong demand just above the resistance zone.
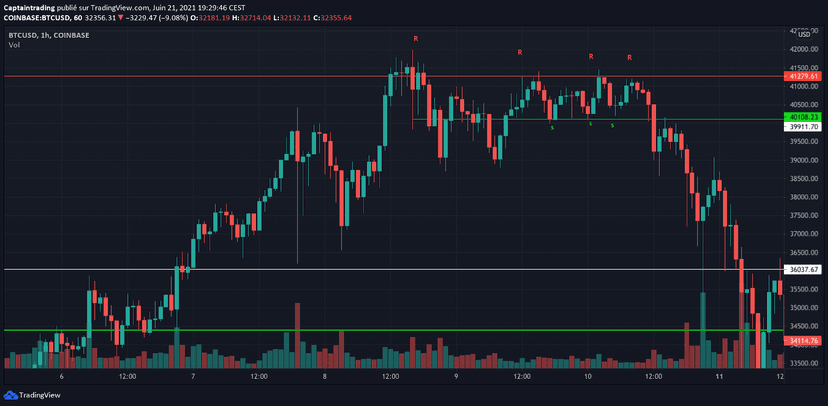
You’ll notice the exact opposite with a breakdown.
Finding High-Win-Rate Entry and Exit Points
To do that, let’s first look at the following concepts:
- the fake breakout/breakdown
- stop-loss hunting
It’s important to understand these 2 concepts clearly, because that will let us come up with a coherent response.
The Classic Institutional Trap
Institutional players hunt retail traders on both their long and their short positions within the same zone, which is why it’s important to understand what this involves regardless of our positions. You have to understand that big positions look for liquidity wherever it sits, namely around S/R. This isn’t solely to hunt stop-losses. The goal can also be to quietly position on the sell side. The aim can be to place their entries … at the edge of high-potential zones, cf. Liquidity / Order Flow or Order Blocks ( SMC )
What better way than to buy in order to trap the breakout buyers and position on the sell side — the buyers will be forced to dump their positions at market, hence the sharp drop that follows.
Here’s a first example of hunting longs at a resistance.
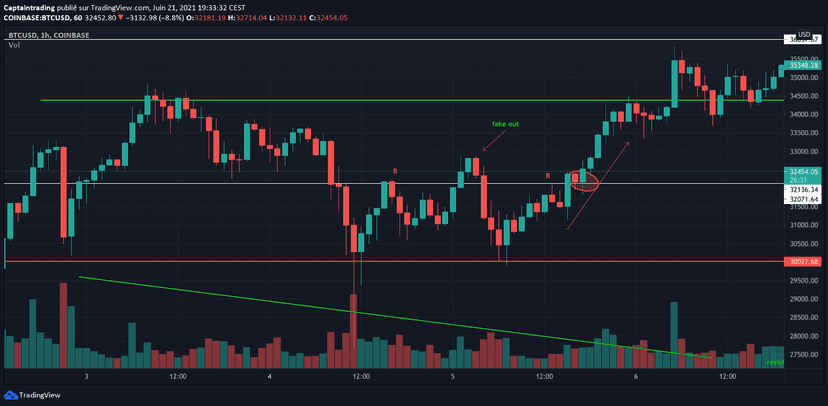
The red line shows the resistance.
At the resistance, many traders go short; you then notice a false breakout or fakeout, which can trigger the overly tight (or rigid) stop-losses of the shorts and the longs respectively.
On top of that, the breakout buyers get positioned at the same time, which amplifies the drop that follows. This kind of trap is perfectly set up to catch the majority, and this kind of pattern repeats over and over!
Never be too rigid with your stop-losses, and remember that support and resistance are relatively wide zones. They’re not exact prices.
On the same example, you can infer a hunt on the longs! A wick pierces the resistance at A, and many traders open long positions thinking it’s a breakout.
Then the trend reverses and the longs are trapped — that’s a hunt on longs at resistance.
You’ll notice the opposite behavior at supports:
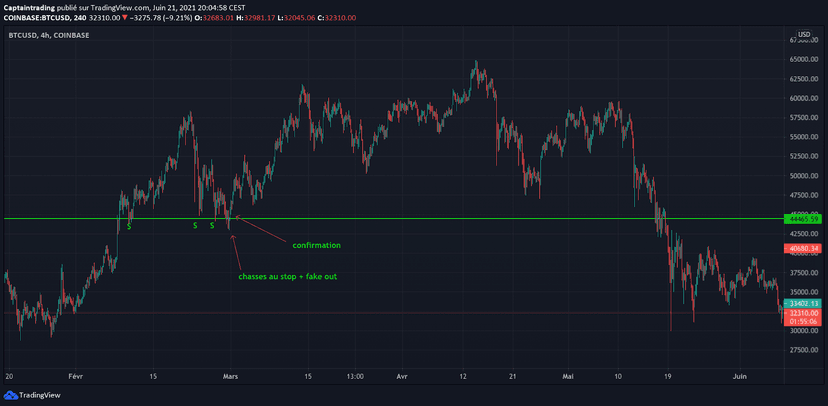
Now that you understand what a stop-loss hunt is and why it’s important to treat these levels as approximate zones; let’s look at the most likely solutions:
Solution A: check the following events
- Confirmation of the breakout/breakdown
- Retest
- Follow-through
The confirmation-and-retest process can be used for both long entries and short entries:
- Breakout confirmation
- Breakdown confirmation
- Support confirmation
- Resistance confirmation
The chart below perfectly shows the retest and confirmation of a support
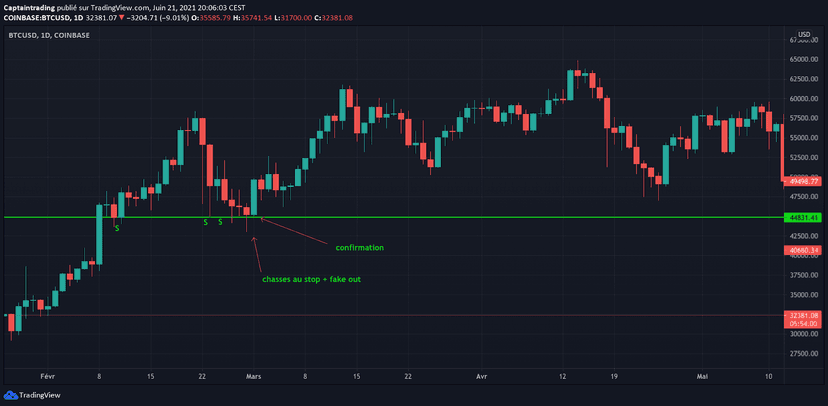
On this chart, the support was clearly defined. The price then comes back to test the support in order to confirm its validity. In this case, it leads to a bullish rally.
In the same way, the breakout is only confirmed once the resistance is broken to the upside, the price comes back to test the resistance zone as a support, and finally you see a bounce.
On confirmation, it’s strongly advisable to be positioned long.
Here’s the opposite example with a resistance:
Solution B
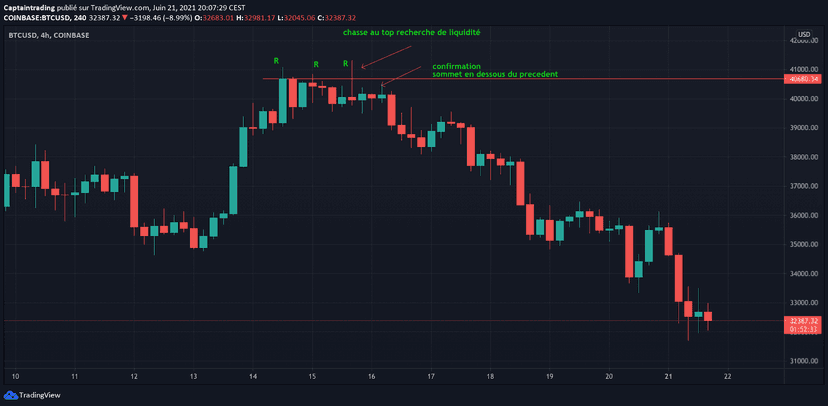
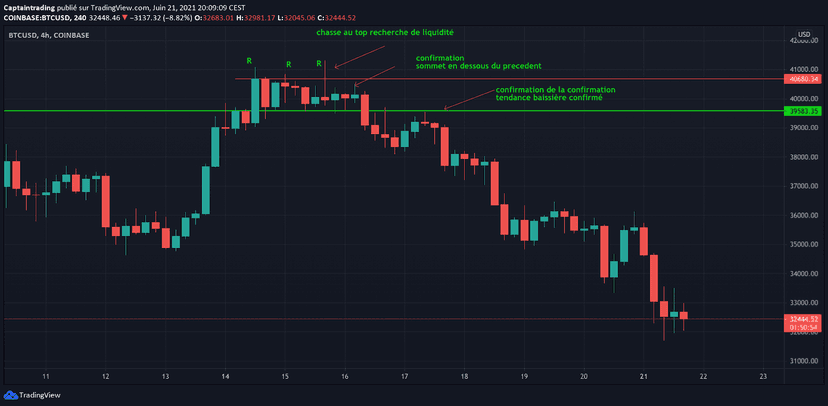
After a breakout, or after a bounce off a support or resistance, wait for the price to break a new resistance or new support. I call this the confirmation of the confirmation.
In the example below we have a fakeout then a breakdown. In this solution B, we’re far more conservative because we enter on the confirmation of the downtrend. When the price comes back to retest the old support turned resistance, we enter short.
I hope this complete recap of support & resistance was useful whether you’re a beginner or experienced, and I’ll see you very soon for another free trading course.
Drawing Support and Resistance: Video Tutorial
Now that you have the theory for drawing support and resistance at your disposal: here, as an appendix, is my video tutorial to finish illustrating my point about drawing support and resistance:

Every guide here is free. Browse the full course and join a community of traders who share ideas every day.