What do our cryptos do 80% of the time?! They sit in a range! The same goes for forex, commodities and most financial markets. So if you don’t have a range-trading strategy, you’re in for some boredom — uptrends and downtrends only account for 20% of a market’s activity.
So what do you reckon — do I sit on my hands until the next expansion, or do I trade the range to keep banking gains between the Bull and the Bear Market?! I think you’ve already guessed my answer.
If learning to draw your horizontal channel and trade ranges with the Captain sounds good to you, then you’re in the right place! And remember: training yourself in trading is essential if you want to perform.
Being an independent trader is even harder than trading the stock markets for a big firm, because as a retail trader you’re managing your own personal funds!
Alright, let’s get started! In this free range-trading course, we’re going to break down a BTC range together — the one that played out between spring and summer 2023, right on the doorstep of the autumn pumps!
Range Trading: Definition
The concept of a range is fairly simple, since price moves between an upper boundary and a lower boundary. It’s a game of ping-pong inside a horizontal price channel!
Generally, once you’ve managed to define your range clearly, price will show a very low probability of pushing through these support and resistance levels — price is then in consolidation.
It can stay in this configuration for quite a while. What’s more, this range context is often a necessary prelude to a bullish reversal or a downtrend reversal. That’s exactly why it’s worth learning to trade it and to draw it correctly — now let’s get down to business: let’s draw this range!
Defining a Range, a Horizontal Price Channel
Defining a Range: Step 1
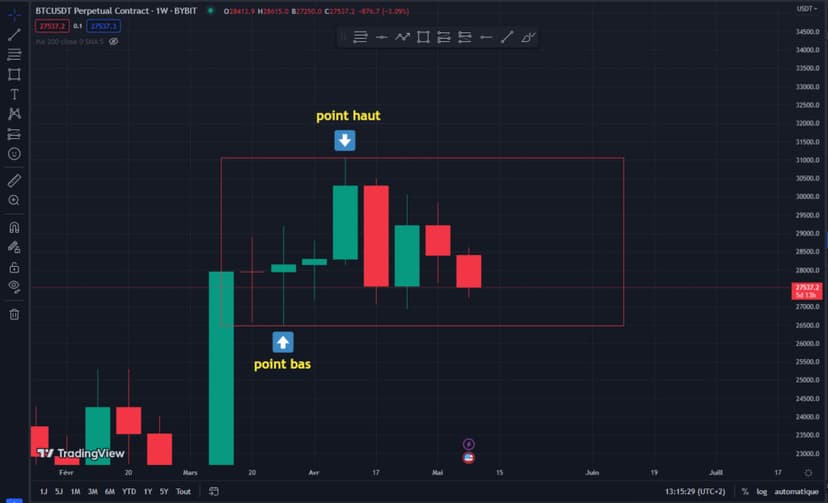
During your technical analysis, start from the weekly, grab the tool to draw a rectangle and:
- Define your low point, which will be your support line
- Define your high point, which will be your resistance zone
- As you zoom out, it should become clearer and clearer!
Step 2: Which tool should you use to draw your range?
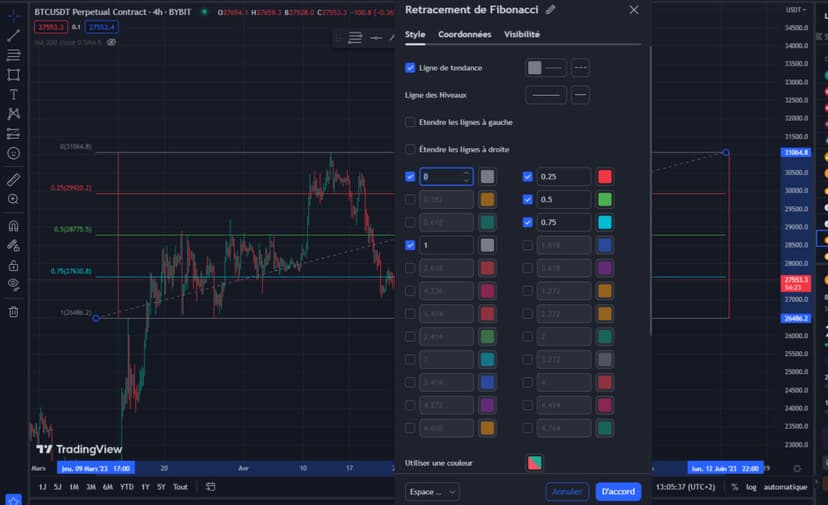
- I’d encourage you to reach for our Swiss Army knife: Fibonacci retracements!
- Switch to a daily or 4H timeframe and drag from the bottom to the top of your range, click the settings in your Fibonacci toolbar, uncheck every box and add 0 – 0.25 – 0.5 – 0.75 – 1 respectively; you can also remove the background or the price from your Fibonacci for better readability, or to keep your chart cleaner — your call!

1/ Setup
2/ The Expected Result
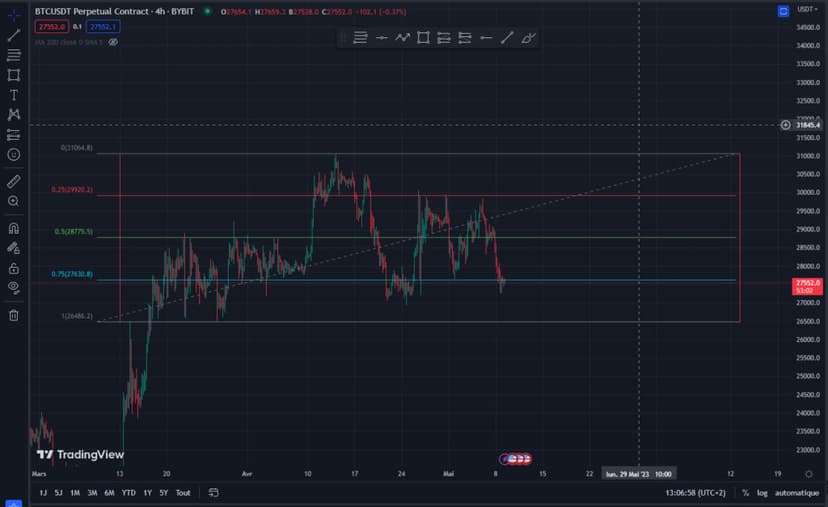
The midpoint and the quarters of your range appear. As you zoom out further, the levels become clearer. From there, feel free to refine your timeframe by using lower — and therefore more precise — timeframes.
The supports and resistances of your range will also become more and more precise.
If you’re still struggling to define your supports and resistances cleanly, I’d encourage you to revisit my course on the subject.
Drawing Support and Resistance

Likewise, if Fibonacci still isn’t clear enough for you, I’d encourage you to revisit the topic with the complete course on Fibonacci retracements that’s linked here — you also get a hands-on video course (it’s my most-watched course on YouTube)!
Fibonacci Retracements | The Fibonacci Sequence

Step 3: Slice up your range
To maximize the number of opportunities while price sits in a range, you can slice it up and thus adapt it to your trading style.
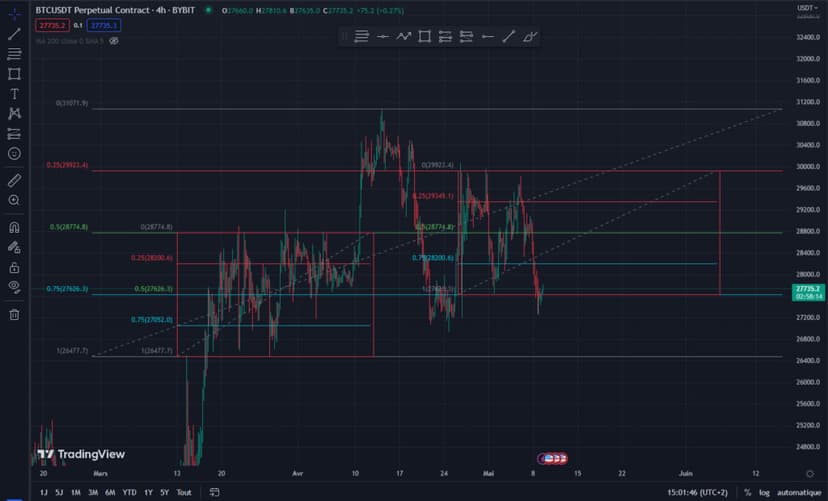
That’s right… there really are ranges within the range; unfortunately it’s not the tidy game of ping-pong bouncing top to bottom that I suggested a little too simply above.
Let’s say range trading is more like a set of Russian nesting dolls!
Want an even smaller range?
How to dissect your Range: Step 1
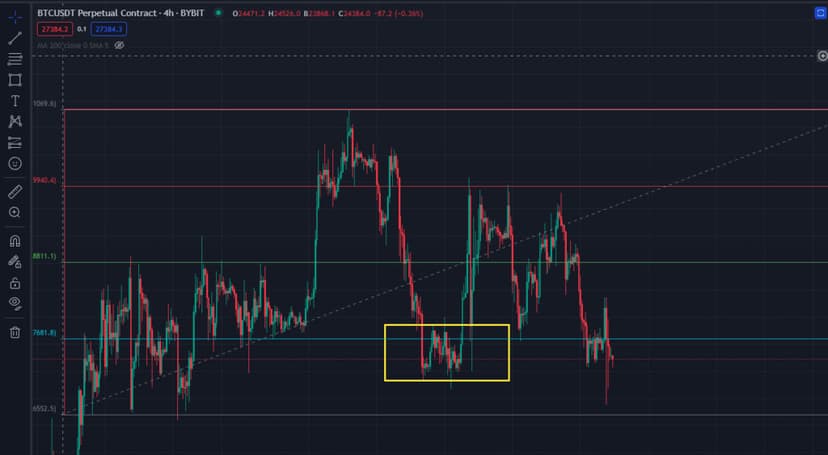
How to dissect your Range: Step 2
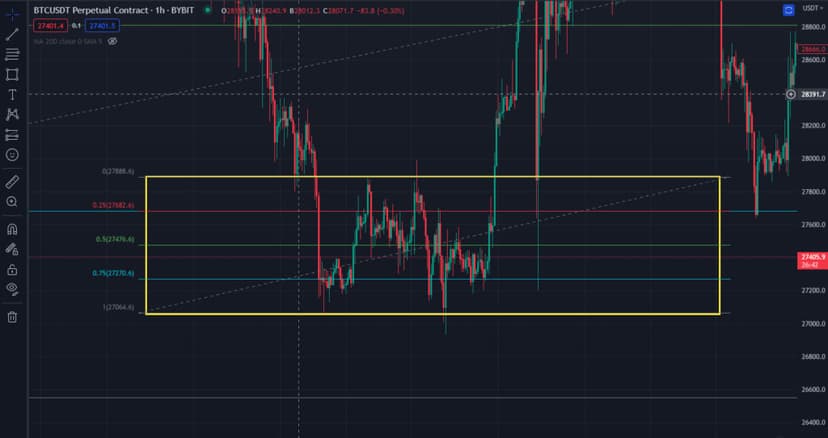
Depending on the style you intend to develop, you can zoom in on the timeframes that interest you to do scalping, intraday trading or even swing trading.
In the case of a swing, the breakouts and breakdowns are relatively rare, but if you’re ready, the profits are much bigger.
In the meantime, rest assured: range trading is flexible and lets you blend different trading styles!
Dissect the range(s) in front of you and use Fibonacci retracements to map them out cleanly!
A quick tip: stay alert when you drop down to a smaller timeframe!
The smaller the ranges you trade, on lower timeframes, the higher the volatility and the more likely the range is to break one way or the other!
A range on H1 will be far easier to break than a range defined on the H4 timeframe, for example. So, every time you drop to a lower timeframe, be extremely careful and adjust your risk management before you commit.
In any trading plan worth its salt, you calculate your position size to perfection!
By the way, a reminder that the stop-loss is the instrument that lets you actually put your risk management into practice! If you haven’t yet mastered the stop-loss on the platform you use, whatever you do, make sure you get on it before placing an order!
Calculating your position size

Range Trading: Basic Strategies and Tips
1. Select the timeframe and the range that suit your trading style
Swing Trading, Day Trading or Scalping!
2. Buy the support
Or you go long on it. In this scenario, it’s essential to position yourself as low as possible: in the extreme low zone of your range!
Then I’d encourage you to plan at least 2 take profits:
Take Profit 1: Mid Range
Take Profit 2: Top of the range
3. Sell the resistance
Or you short it, same principle as on the buy side: place your order in the extreme zone.
Then I’d encourage you to plan at least 2 take profits:
Take Profit 1: Mid Range
Take Profit 2: Bottom of the range
4. The Mid Range
The middle of the range alone would deserve a whole course. It’s THE key zone of the range: it’s the heart of it and can therefore act as a pivot zone!
This mid-range level can very quickly turn into support, but also resistance. It’s what determines whether price stays in the lower half or the upper half of the range.
I only take a position at the mid range if this level shows obvious signs of strength. To gauge that, I mainly take price action into account.
For example, a downside break through the mid range followed by a reclaim: Fakedown
5. Bonus | Swing Entry: anticipating the break of one of our boundaries
Speculating on the breakout or breakdown of the range is risky if it’s our core strategy! That said, scaling out our exit to keep our options open can be worthwhile in certain market conditions.
Indeed, the more a level gets hit, the weaker it gets: at some point, it cracks.
I’ll say it as many times as it takes: this is risky!
So you need to be especially careful. If you’re not confident, it’s better to lock in as much profit as possible before risking it with a larger or smaller portion of your position:
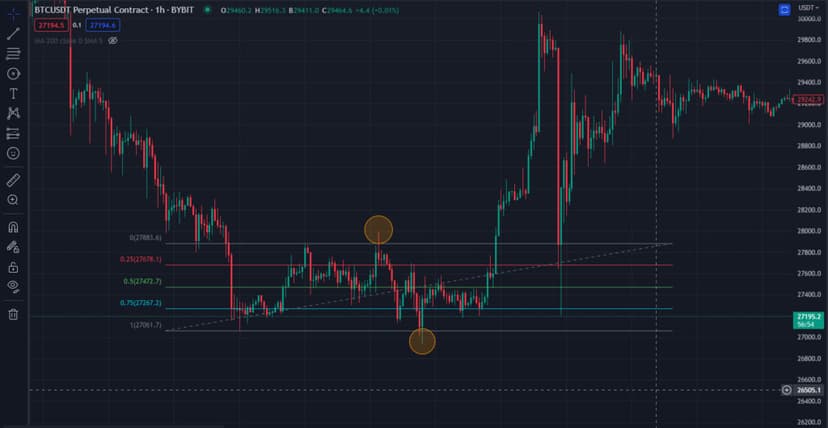
- To find a swing trading entry in a range, there’s one very important rule to follow. It’s the principle I like to call the “liquidity grab”. This concept is perfectly valid for short-term range trading too.
- The market very often comes to hunt stop-losses at the extremes of a range. In the first half of 2023, it almost became normal to see both sides scraped within a few hours on the crypto market.
- Eventually it reclaims after flushing out a MAX of retail traders.
A move up or down can then start to express itself. From there, you’ll be able to put your swing strategy into action.
Example of liquidity grabs on both sides of the range and a breakout
Tips for your Trading Plan
Tip 1
NEVER forget your Stop-Loss ! Otherwise, liquidation is what’s waiting for you!
Stop-Loss: 5 mistakes to avoid

Tip 2
Once you’ve positioned in the extreme zone, you can set 2 TPs:
TP1: I recommend placing the first take profit at the mid range (the middle of the range).
TP2 : Then you place the next take profit at the extreme boundary
You can also mix things up by, for example, placing TP1 at the mid with 50% of your position, 25% at the 3/4 level and 25% at the extreme boundary, thereby using 3 TPs.
Which technical indicators should you choose for range trading?
RSI: Relative Strength Index
the Relative Strength Index, or RSI can tell you, for example, when a bullish or bearish divergence is forming inside the range; if it forms as price approaches one of the range’s boundaries, there’s a good chance price reverses back inside it, and you can then adapt your strategy based on this extra signal.
Hands-On Trading Course: The Relative Strength Index (RSI)
Open Interest
Open interest is an excellent indicator in a range: if it spikes sharply as price approaches resistance, it may be time to flip short at resistance — that’s a bit of a red flag for me! It could mean that long positions are being opened in large numbers during the rally, and the market may look to punish the speculators.
Conversely, an open interest that drops sharply inside the range is more of a bullish reversal signal: it’s the sign that a strong capitulation is underway, that the majority of market participants are worn out by the range and no longer dare to take a position inside it. If it’s falling and liquidity grabs have been taken on both sides of the range — watch out, big reversal signal!!
Hands-On Trading Course: Open Interest & Funding

Chop Index
The chop is also a great indicator to warn us when the range has matured enough and is ready to break.
If the chop is loaded on the Daily, then the daily range is likely close to giving way. That’s exactly why I love this indicator — it acts as a complementary early-warning signal!
Same goes for a chop loaded on H4 — the principle is the same.
The Trading Patterns I Use in a Range
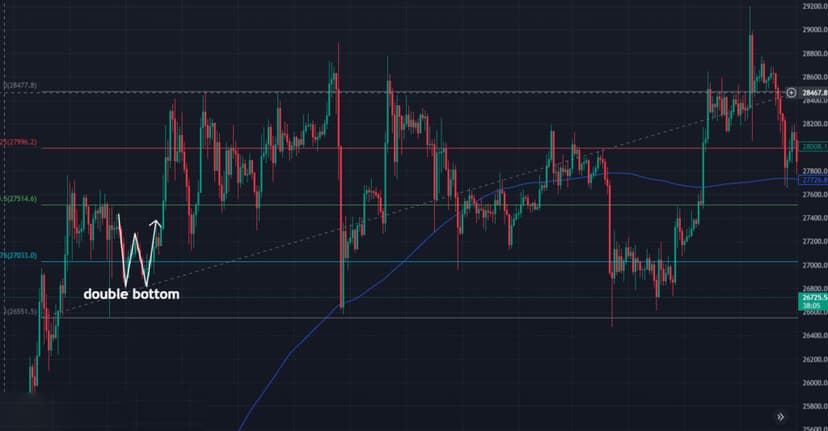
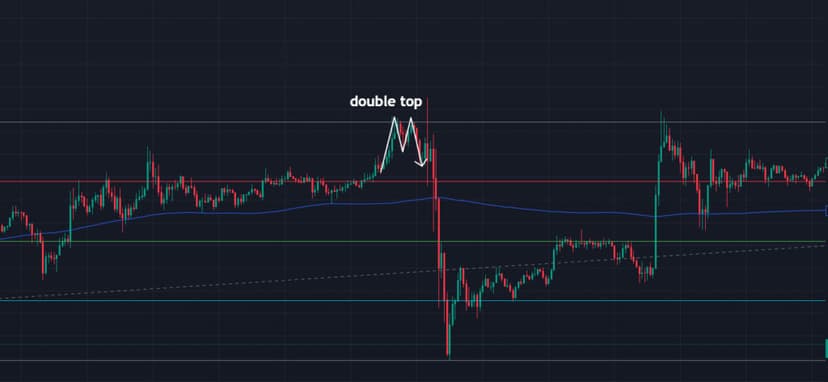
I mainly use two trading patterns in the range, the double bottom and the double top, and I invite you to discover them here. As a reminder, I only recommend reading patterns that are in confluence with our price action.
2 Trading Patterns That Work Well in a Range
The Double Bottom
The Double Top
Range Trading: The Captain’s Take
Ranges offer repeated, multiple opportunities to make gains in trading.
Depriving yourself of trading in this context over the long run is therefore a mistake, since it concentrates roughly 80% of the opportunities to enter.
Some market participants are literally bored during these phases. More often than not, they’re the least experienced traders chasing overly ambitious profits (an unbalanced R:R).
Personally, I find range trading very dynamic — because it brings together so many opportunities, but also because you can trade a range in both directions!
Would we be wrong to deprive ourselves of range trading?!
The answer is YES if you want to become a pro trader over the long haul: no need to wait for the bull market to be profitable!
Finally, if you’ve got this down and it was just a walk in the park, you can always figure out what to do with your cash thanks to my money management tutorial
Every guide here is free. Browse the full course and join a community of traders who share ideas every day.