AI trading is defined as the use of artificial intelligence in the process of analyzing market data, either to generate investment ideas or to act directly on our behalf. The use of AI in the markets has revolutionized the financial sector and the trading world by making it more efficient. If AI trading has grown so popular in recent years, and so many traders and investors are adopting it, there’s a good reason for it: the Results!
AI trading generally involves the use of algorithms and machine-learning techniques to analyze vast amounts of data and identify patterns and trends in the market.
Thanks to a computer program, the risk of errors between intention and execution — what we also call human error — can be considerably reduced!
Precision is another undeniable asset of trading assisted by artificial intelligence!
In short, you get the idea: going without artificial intelligence in the markets in 2024 is a shame at the very least, if not a considerable amount of money left on the table.
That’s why the Captain Trading community has begun developing automated systems dedicated to decision-making in the financial markets.
So in this guide on AI trading, alongside an overview of the topic, we’ll give you a spreadsheet that lets you take trades on BTC and ETH, following an in-house algorithm built by a member of our community!
⚠️ Heads-up: if you’re mainly interested in our automated strategy, please note that it relies on perpetual and inverse perpetual contracts; we run it on OKX. Check whether derivatives are available from your country before you start. Depending on the platform you choose, your results will differ: this is a strategy that borders on high-frequency trading, where the smallest differences in market movements can have a considerable impact!
On the agenda:
AI Trading: the Guide!
AI Trading: Definition
AI trading, also known as algorithmic trading or algo trading. It’s a method of executing transactions on the financial markets using computer algorithms. These algorithms analyze larger or smaller amounts of data — such as historical price movements, market trends, and economic indicators — in order to identify patterns and make trading decisions.
Recently, the use of artificial intelligence in the markets has gained ground thanks to its ability to analyze large amounts of data quickly and accurately, which lets it identify patterns and make decisions faster than any human could ever hope to.
Trading-focused AIs have evolved considerably over the years, using increasingly sophisticated machine-learning algorithms. The use of AI in trading has quite simply allowed traders to make better decisions by analyzing large amounts of data quickly and accurately.
On top of that, AI has enabled some traders to automate their trading strategies, allowing them to seize market opportunities 24 hours a day, 7 days a week. And I’ve already given you a taste of this in the first part!
Of course, artificial intelligence is used on traditional markets as well as in cryptocurrency trading.
AI Trading: the Main Uses and Technologies
- machine learning,
- natural language processing
- massive-data analysis: big data
- Automatic order execution
Machine-learning algorithms are used to analyze large amounts of data in order to identify patterns and make longer-term trading decisions.
Natural language processing makes it possible to analyze news articles and other information sources in order to identify market trends and opportunities.
Massive-data analysis (big data) is used to analyze large amounts of data in order to identify patterns and trends in the market.
Beyond these 3 main aspects, AI trading platforms also use advanced algorithms to execute transactions automatically. These algorithms are designed to capitalize on market opportunities the moment they arise, letting traders make better decisions without delay and thereby increase their profitability.
Overall, AI trading is a fast-moving field that offers traders a whole range of advantages. By using advanced algorithms and technologies, traders can analyze large amounts of data quickly and accurately, identify market trends and opportunities, and automate their trading strategies to capitalize on market opportunities 24 hours a day, 7 days a week.
AI Trading: the Advantages
There are many reasons why investors and traders may be drawn to artificial intelligence — we’ve already mentioned a few, but it can go much further! Here are some of the specific benefits of using artificial intelligence in trading:
- Reduced research time
- Automation
- Better forecasts and reporting
- Cost reduction
- Scalable technology
- No emotions
- Fast trade execution
- Effective backtesting
All in all, AI trading — trading assisted by artificial intelligence — brings tremendous added value to the financial markets!
Algo Trading: the Different Types of Algorithmic Trading
Quantitative Analysis
Quantitative analysis can be applied to both technical and fundamental analysis. It’s a popular approach to algorithmic trading. It involves using mathematical models and statistical techniques to identify patterns and trends in market data. A trader can use these models to develop trading strategies that exploit market inefficiencies and other opportunities.
For example, regression analysis is a very common quantitative-analysis technique. In fact, if you went to business school, the term should ring a bell — especially if I say “linear regression,” right?!
Regression analysis is a statistical approach used to explore the connection between dependent and independent variables. In other words, it serves to analyze how the independent variable influences the dependent variable.
This technique involves analyzing the relationship — even the correlation — between two or more variables in order to identify patterns and trends and capitalize on the projections!
High-Frequency Trading
High-frequency trading (HFT) is a type of algorithmic trading that involves executing transactions at very high speed.
HFT strategies rely on sophisticated algo trading, but also on ultra-high-speed data-transfer networks, in order to execute transactions within fractions of a second. This speed is essential, which
HFT strategies are designed to profit from small price movements in the market. As such, for a trader, using HFT to execute large transaction volumes quickly and efficiently can also cut fees considerably, making it possible to turn a profit in niches that wouldn’t be profitable otherwise.
Indeed, High Frequency Trading, in essence, “means”:
- Large transaction volume
- A very high number of orders
- Low but steady profitability
So it’s essential not to get it wrong when it comes to calculating the break-even point!
I dug up a documentary I watched a while back on high-frequency trading. If this is a topic you’re passionate about, it’s a solid watch for understanding what’s at stake with this strategy!
Arbitrage
Arbitrage strategies consist of profiting from price differences between two or more markets.
One of the most common arbitrage strategies is statistical arbitrage. This strategy consists of identifying assets that are mispriced relative to one another, then buying and selling those assets to make a profit.
Statistical arbitrage is designed to capitalize on market inefficiencies and other opportunities.
This term — if I’ve read my audience right — you’ve probably heard more than once, so we won’t dwell on it; let’s just recall a solid definition! Arbitrage was an incredibly lucrative activity as recently as 2 or 3 years ago on the crypto market. In fact, for those who still remember, that’s how SBF started building his fortune through Alameda Research!
Today, arbitrage on the crypto market is probably still profitable, but it has certainly become far more competitive!
In the past, all it took was being registered on a few crypto platforms around the world, holding substantial funds, buying on the platforms where a market imbalance leaned toward supply and selling on the platforms where the imbalance leaned the other way.
Wars, for example, have in recent years created significant arbitrage opportunities on local platforms for anyone — but it’s also a profession, and some people do nothing else!
As a result, in a market whose competitiveness is growing exponentially, AI trading has become indispensable to the practice of arbitrage on the financial markets.
AI Trading and Machine Learning
Predictive Models
Predictive models have almost certainly been used ever since people had information, data, and a method to interpret them. That said, modern predictive modeling reportedly began in the 1940s, when governments used the first computers to analyze weather data, among other things…
Over the following decades, software and hardware capabilities grew, making it possible to store large amounts of data and access it more easily for analysis.
Internet connectivity has made it easier for anyone with access to accumulate, share, and examine vast amounts of data. As a result, modeling has expanded to cover almost every area of business and finance. For example, it’s perfectly common in the marketing world to see predictive modeling used. And of course — this is the part that interests us — financial analysts also use it to estimate trends and events on the stock market.
Uses of Predictive Models
Predictive analytics uses predictors, or identified features, to build models with the goal of reaching an outcome.
Predictive analytics can be used in hundreds, even thousands, of ways. For example, investors use it to spot trends in the stock market or in individual securities that could signal investment opportunities or decision points.
One of the models most commonly used by investors is the moving average of an investment, which smooths out price fluctuations to help them identify trends over a defined period. In addition, autoregression is used to establish a correlation between the past values of an investment or an index and its future values.
Predictive modeling is also a valuable risk-management tool for investors, since it makes it possible to identify the potential outcomes of various scenarios. For example, the data can be adjusted to predict what might happen if a fundamental condition were to change.
The Various Forms of Predictive Modeling
There are several distinct forms of predictive modeling that can be used to analyze most datasets in order to uncover insights about upcoming events.
Classification Predictive Models
Classification models draw on machine learning to sort data into categories or classes according to criteria defined by the user. There are several types of classification algorithms, a few examples of which are below:
Logistic regression: An estimate of whether an event will occur, usually a binary classification such as a yes-or-no answer.
Decision trees: A series of yes/no, if/else, or other binary outcomes presented in a visualization called a decision tree.
Decision tree: An algorithm that combines unrelated decision trees using classification and regression.
Neural networks: Machine-learning models that comb through enormous volumes of data to detect correlations that only emerge after analyzing millions of data points.
Naive Bayes: a modeling system that relies on Bayes’ theorem to establish conditional probability.
Clustering (Grouping) Models
Outlier Models
Time-Series Models
These guides stay 100% free. If you open an account on our partner exchange OKX, you help keep it that way — and you get a welcome deal.
- ✓ $400 welcome bonus on your deposit
- ✓ Low fees, deep liquidity, advanced tools
- ✓ Spot, futures and options in one place
Affiliate link. Trading involves risk of loss — never invest more than you can afford to lose.
AI Crypto Trading, Scalping Style!
For research purposes, we’ve decided to share this strategy, built from A to Z by a member of the community. Feel free to let us know how your tests go in the comments! It’s relatively easy to use, but you absolutely need a bit of practice before going live!
Building a Screener from a Simple Strategy
There are countless ways to build an automated trading system, as well as many levels of automation: you might want to automate everything (from decision-making all the way to order execution) or simply give yourself a personal, complementary tool while continuing to act manually on the market.
Community-Built Automated Strategy
From here, we’ll hand things over to one of our students, who’s going to walk you through an automated model he developed based on USD/USDT disparities to capture trade opportunities on a very short timeframe.
Today, I’m going to introduce you to a screener based on a simple strategy, designed to hand you entries as well as scalp trade setups. The idea is to grab moves on very short timeframes to keep your exposure to an absolute minimum.
You’ve got the full breakdown of my reasoning; don’t hesitate to ping me if you have questions or suggestions for improvements 🙂
Test Statistics as of 27/04/24
- roughly 1 setup every 3 minutes (across all reliability levels)
On average (the sample is small, so not necessarily representative) - 5% strong
- 16% medium
- 43% weak
- 36% kamikaze
Success rate : 64% across all sensitivity levels
Sample: 403 Setups
Context
The USD/USDT Correlation
In theory, 1 USD = 1 USDT; however, temporary divergences can sometimes appear. Several reasons can explain this:
- Liquidity
- Volatility
- External influences (confidence in USDT or USD)
The goal of my strategy is to spot these divergences and profit from them.
Perpetual and Inverse Perpetual Contracts
These are futures contracts with no expiration date, so you can keep a position open indefinitely, as long as you can cover the fees associated with the contract.
The advantage? They let us speculate without having to own the underlying in question.
In our strategy, we use inverse perpetuals as a hedging tool; and finally, one last point worth noting, perpetual contracts also let us use leverage
* Disclaimer: Leverage is dangerous — stay humble, or you risk getting wiped out 🙂
Choosing the Platform
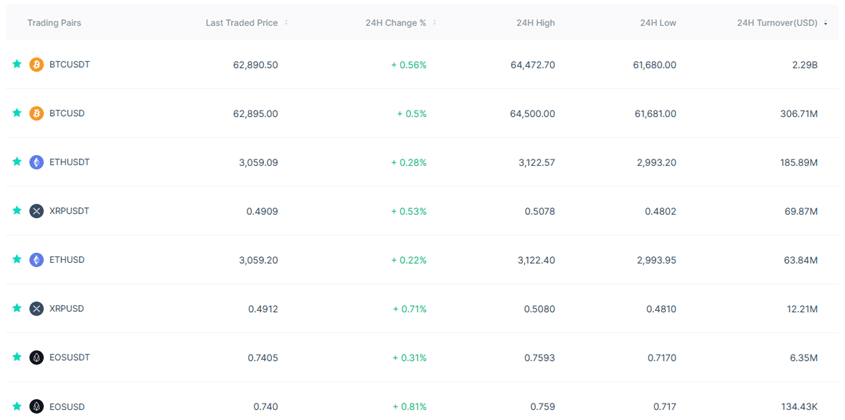
For our strategy, we use OKX: the platform offers both USDT-margined perpetuals (the “PERP,” e.g. BTCUSDT) and coin-margined perpetuals (the “Inverse PERP,” e.g. BTCUSD) on the major pairs like BTC, ETH, and XRP
Perfect for our strategy: we can play the USD/USDT correlations on these pairs.
Hedging
Simply put, hedging means opening a long position and a short position on the same asset to protect yourself in case the market moves the opposite way from what you anticipated.
Typically: 1 long, 1 short
- If the price drops, the short covers the long
- If the price rises, the long covers the short
Strategy: Let’s Get Down to Business!
As mentioned earlier, we’re going to build a simple strategy based on USD/USDT divergences, using perp and inverse perp contracts to our advantage, with a dash of leverage on top 🙂
The USD/USDT Correlation
1 USD = 1 USDT, most of the time.. the USD/USDT correlation is extremely strong, and the divergence periods, although very short, still exist.

Here, we can see a micro-gap of 8.4 points between BTCUSDT and BTCUSD.
Starting from the premise of the USD/USDT correlation, two conclusions are possible:
- USDT could rise to meet USD
- USD could fall to meet USDT
So the question is: how do we know which one will meet the other?
Technical Analysis to the Rescue
We know that USD/USDT divergences occur on very short timeframes, so we can use a bit of technical analysis on BTCUSDT to identify a trend.
Note: other technical-analysis methods and other indicators can be used; here, I’m going to give you simple indicators. You can make the technical analysis I’m proposing more complex, modify it, or alter it however you like — the goal is to understand the strategy as a whole.
Correlation of Technical Indicators
For our example, we’ll use the correlation of technical indicators to infer the direction (USDT toward USD or USD toward USDT).
The chosen ones are: MACD / RSI, / Bollinger Bands and EMA
A blend of these technical indicators to define a (very short-term) trend intention on BTCUSDT: this consensus then gives us a sense of the market’s potential direction on this pair. We’re literally playing the probabilities.
The Logic of Our Strategy
- If BTCUSDT < BTCUSD
- If technical analysis suggests a rise on BTCUSDT
- Then BTCUSDT should meet/exceed BTCUSD
Suggested position:
- Long Perp BTCUSDT, with leverage to increase the expected gain
- Short Inverse Perp BTCUSD, without leverage (for hedging)
Conversely:
- If BTCUSDT > BTCUSD
- If technical analysis suggests a drop on BTCUSDT
- Then BTCUSDT should meet/drop below BTCUSD
Suggested position:
- Short Perp BTCUSDT, with leverage to increase the expected gain
- Long Inverse Perp BTCUSD, without leverage (for hedging)
Important considerations
- Basis risk: The positions won’t fully hedge each other if the USD/USDT ratio doesn’t normalize
- Transaction costs: In this kind of strategy, where profits are fragile, you absolutely must factor in the platform’s fees! A trade can look attractive, but once the fees are deducted, it wasn’t worth it
- Volatility: Cryptos are extremely volatile, market conditions can be extreme, and liquidity can have a big impact on your trades — better safe than sorry
- Your PnL depends on your leverage, your analysis, and your appetite for risk — again, be careful
⚠️ Finally, an important point to keep in mind: the moves we’re after are on extremely short timeframes, and placing 2 orders correctly within a few seconds is a challenge — ease into it and practice!
The Weakness of This Strategy
The big weakness of this strategy lies in the reactivity it demands. Between analyzing the elements we mentioned above, setting up the 2 trades, and execution, you’ll have your hands full!
For the boldest among you, I’ve put together a cheat sheet that gives you setups based on this strategy. You’ve already seen it go by — it’s right at the top of this article! What you may not have noticed is that it updates automatically !
It’s laid out as follows:
- Reliability: Ranging from Kamikaze to High, the reliability tells you about the risk of the proposed setup
- Direction : Bullish/bearish
- The product: Perp or Inverse Perp
- The ticker: BTC/ETH/XRP or EOS
- The platform’s Last Traded Price
- Order type: Long or Short
- TP: Take Profit
- SL: Stop Loss
All the elements of the document speak for themselves, but a few of them need some clarification:
- The Last Traded Price is the last price traded on the platform for the product (perp or inverse perp); it is updated every minute.
- The TP and SL are suggestions; you can fine-tune them however you like. That said, note that here they’re indexed to the ATR and the platform’s fees, and are automatically updated as market conditions evolve
⚠️ The goal isn’t to give you signals, but rather potential, attractive entries on this kind of setup!
How Do You Place the Orders?
For execution, we use OKX (remember to check availability from your country). The principle stays the same: place your main position (Long or Short) on the USDT-margined perpetual with a bit of leverage, then the opposite order on the coin-margined (inverse) perpetual for the hedge, entering the Take Profit and Stop Loss suggested by the cheat sheet.
⚠️ Leverage is dangerous: start with a small position size and practice in demo before going live.
⚠️ What Follows Is Very IMPORTANT for Beginners ⚠️
For the greenest beginners among you, here are the settings I suggest, along with how to use the sheet while you’re cutting your teeth:
- Only trade BTC and ETH
- Only place the Long and Short 1 orders, not the hedge order – You won’t have time to place both correctly
- Order size at 70 – Without a hedge, you’re not risking much, so nothing too damaging if you mess up
- Only take the Medium and High reliability levels
- Adjust your trades depending on when you entered – if you see you can move your SL up, do it! Conversely, on the TP, don’t get too greedy
Finally, and more generally, the ideal is to keep the sheet visible on one of your screens, or minimized, so you’re ready to act on BTC and ETH. Pre-fill your order sizes, and let it roll 🦾!
You’ll see it works in cycles: quiet > it fires off > quiet > it fires off > etc.
Conclusion
Every trading strategy has a goal and variables; the one I’ve shown you today is meant to support you with scalping and booking small but ultra-regular profits. It won’t suit every profile, but we can say with certainty that it does its job.
If artificial intelligence in the markets and AI trading interest you, don’t hesitate to send me feedback in the comments of this article — I’d be delighted to answer your questions 🙂
Finally, a big thank-you to Captain Trading for giving me the opportunity to share my work; we often work alone, and having the team’s support is always a pleasure!
Every guide here is free. Browse the full course and join a community of traders who share ideas every day.