Coinalyze is a comprehensive platform dedicated to aggregating trading data on crypto, and Futures in particular.
It provides specialized data and technical-analysis tools, notably on Open Interest, Funding and Liquidations. Personally, I use Coinalyze above all to compare price against Open Interest.
The tool also offers advanced market-comparison features and highly customizable alerts. Beginners can find their feet too, thanks to the guides, tutorials and articles published on the platform. It’s a complete, data-focused tool that’s relatively easy to get to grips with. What’s more, you can use every feature of Coinalyze.net for free — so no surprises!
Personally, I use Coinalyze every day to correlate the price of the coins I analyze with Open Interest. Don’t overlook what Coinalyze can do, because for me it’s one of the strictly essential tools, right alongside TradingView and BasedMoney!
Coinalyze: Benefits and Strengths
Coinalyze offers many benefits for traders, investors and blockchain enthusiasts. Here are some of the key advantages:
1. Real-time data: Coinalyze provides real-time information on cryptocurrency prices and market trends. This lets us make better-informed trading and investment decisions.
2. Customizable dashboard: We can customize our dashboard to include the information that matters most for our cryptocurrency trading. This saves us time and keeps us focused on what matters most
3. Second-level trading indicators: Coinalyze offers aggregated indicators that let you push your technical analysis further. As you know, I don’t use many indicators, but I absolutely recommend making them converge in order to read signals.
4. Financial news: We can follow the latest market news and events and stay informed about everything happening in the crypto world.
5. A fairly classic but effective UX: Coinalyze is easy to use, even for beginners. We can access all the information we need in just a few clicks.
6. Massive data aggregation: Coinalyze draws on multiple data sources to guarantee the accuracy of the aggregated information.
How to Use Coinalyze
Signing Up
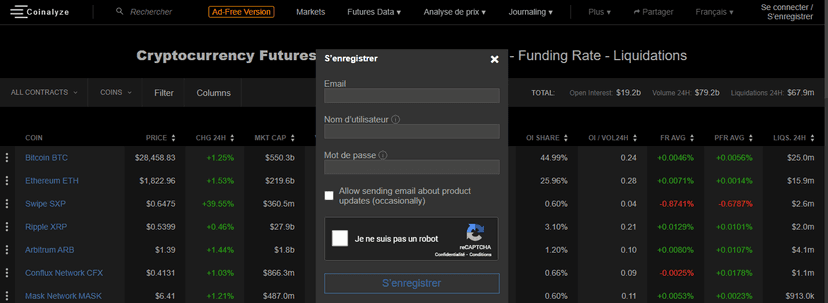
To use coinalyze.net, the first step is to sign up. That said, you don’t even have to in order to get most of the data you actually need.
To do so, click “Log in / Register” at the top right of the homepage and a form opens. Fill in the requested details, such as your email address and a password. If you tick the “Allow …” box, you authorize Coinalyze to email you information about what’s new on the site. Once this step is done, you can start using the tools available on coinalyze.net.
Coinalyze: The Homepage
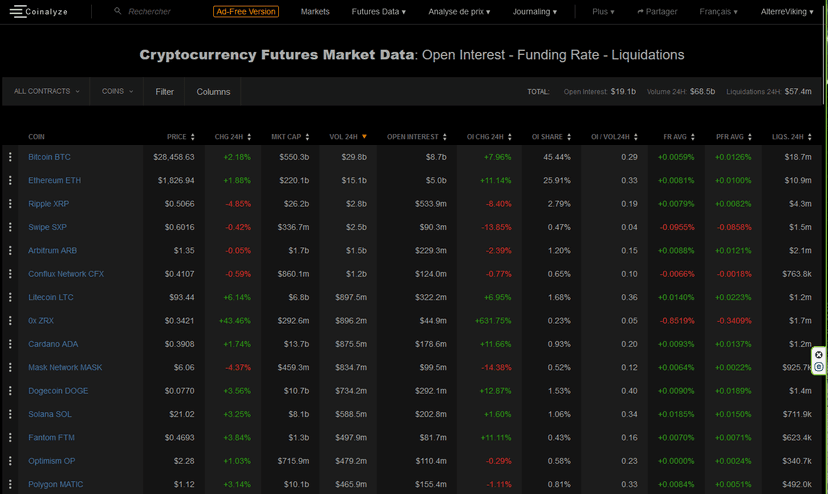
The homepage heading reads as follows: Cryptocurrency Futures market data: Open Interest – Funding Rate – Liquidations
Below the page title, on the right, Coinalyze provides the total open interest, the 24h trading volume and the liquidations that occurred over 24h across every crypto market it tracks.

Reminders:
- In trading, liquidation is an automatic procedure whereby a trading platform closes an open position. It kicks in when the position’s value reaches a level where losses exceed the available margin. This protects both the trader and the platform against excessive financial losses.
- The Open Interest in trading represents the total number of open contracts on a given market. It’s an indicator of liquidity and of the strength of the trend.
A rise in O.I can signal increased activity on the market. This leads to larger, more volatile price moves. A drop in open interest can signal reduced market activity, leading to lower volatility. Traders can use open interest to confirm a trend or to pinpoint entry and exit points.
- The Funding Rate — more commonly known simply as the funding — is a financing rate applied to the perpetual contracts offered by the crypto trading platforms. It is calculated every hour and determines the fees that holders of long contracts pay to holders of short contracts. Perpetual-contract traders need to keep an eye on the Funding Rate, because it can affect their positions and their profits/losses.

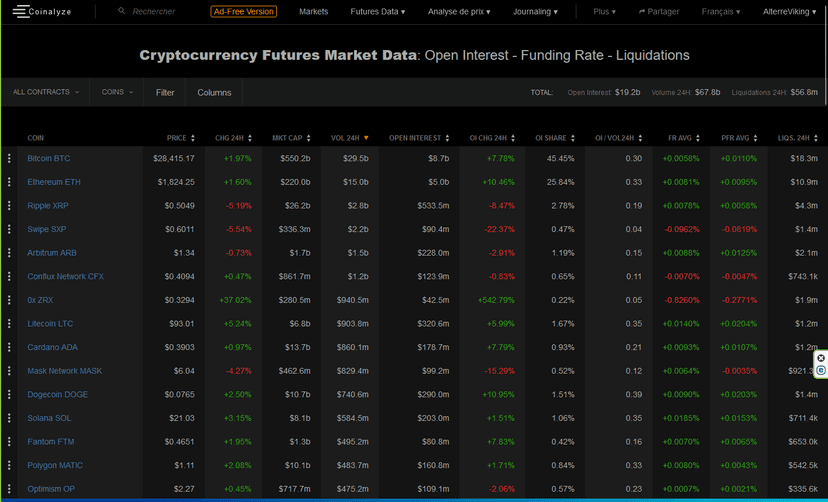
In the table above, you get the essential information about price (PRICE), the 24h price change as a percentage (CHG 24H), the market capitalization (MKT CAP), the 24h trading volume (VOL 24H), the OPEN INTEREST, the 24h change in Open Interest as a % (OI CHG 24H), the 24h change in price by value (OI CHG 24H), and finally the total liquidations over 24h (LIQS 24H).
At a glance, this table gives us an overall view of the crypto market, which is especially useful for making our trading decisions.
Coinalyze Lets You Customize Your Dashboard
Coinalyze.net is a cryptocurrency market data and analysis platform that lets its users set up their own custom dashboard to track the indicators and charts most relevant to them.
Here’s how to set up your custom dashboard on Coinalyze.net:
1. Create a Coinalyze.net user account and log in to the platform.
2. Select the cryptocurrencies you want to track using the platform’s search tool.
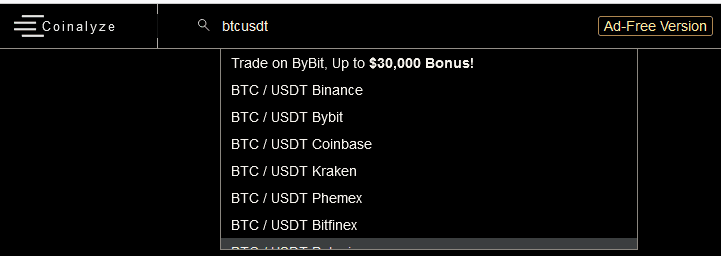
3. Add the market indicators you want to monitor to your custom dashboard by clicking the “Add an indicator” button at the top of the page.
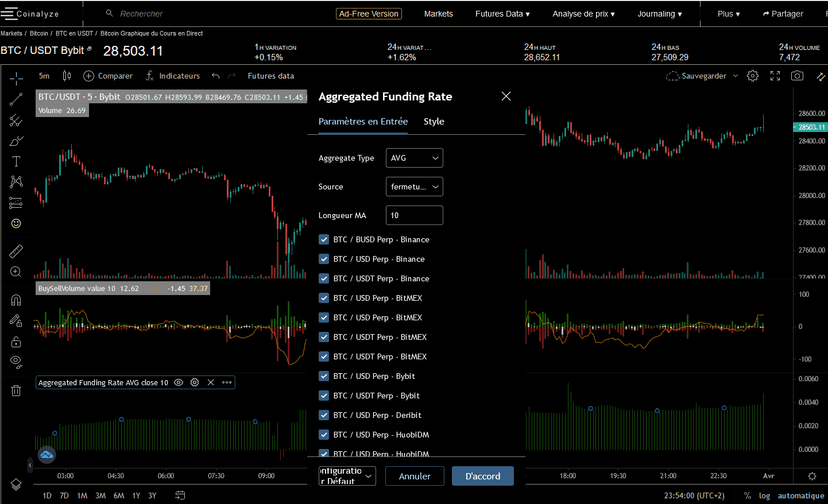
4. Customize your dashboard. You can click the gear icon to go into the detailed settings (fine-tuning). You can also move and resize the charts and indicators however you like. Below is an example showing the Aggregated Funding Rate.
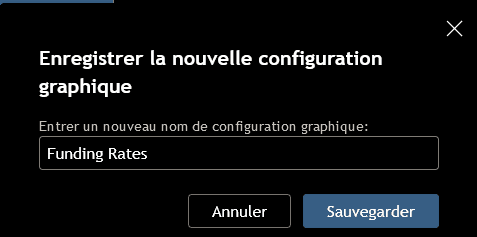
5. Save your custom configuration by clicking the “Save” button at the top of the chart block. A panel then opens, prompting you to save the new configuration.
Once you’ve set up your custom dashboard, you can use it to monitor cryptocurrency market trends and moves in real time.
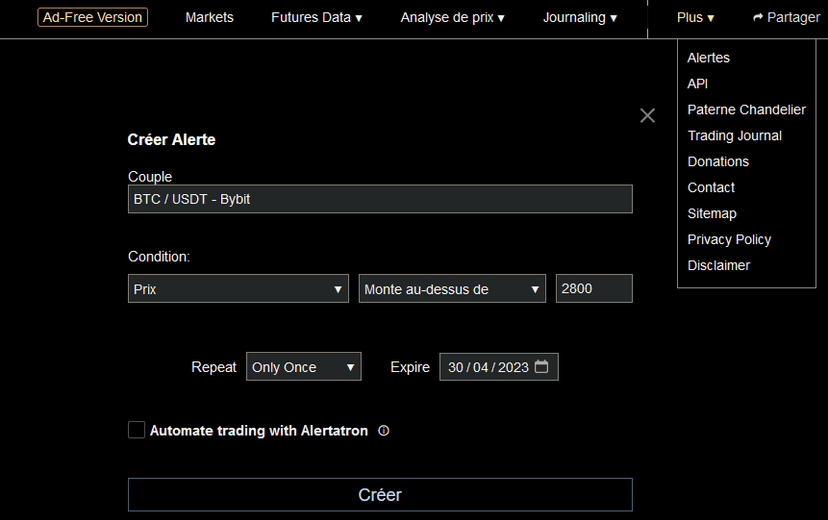
You can also receive alerts and notifications based on the price thresholds or events specified in your custom setup.
Coinalyze: Trading Tools and Technical Indicators

Coinalyze.net offers several advanced trading tools to help traders analyze the markets and make informed decisions. Here’s how to use these tools:
The “Markets” Tab
The “Markets” tab in Coinalyze gives the trader an overall view of the Crypto markets. It lets you consult real-time data on prices and trading volumes for a variety of digital currencies. Traders can also follow market trends and price changes, which is useful for making informed investment decisions.
On top of that, the filter function lets traders search for specific digital currencies or filter their display according to various criteria:
Filtering Coins in the “Markets” Tab
- Currency (BTC, ETH, …): the crypto you want to look at
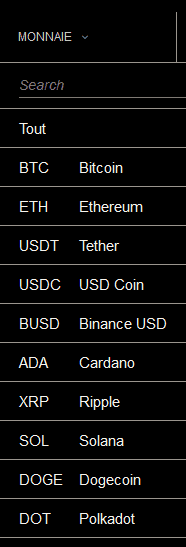
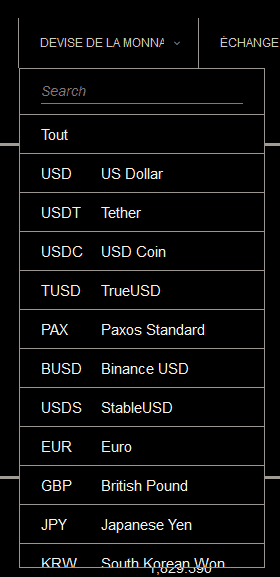
- Quote currency: this refers to which currency you want to value your coin in — for example, if you want to know the value of BTC in Euros (BTC/EURO pair), you should choose Euro from the list provided.
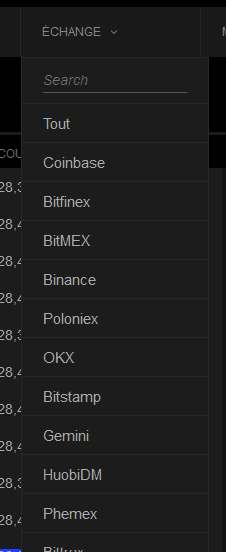
- Exchange: here you can filter your results based on your preferred trading platform.
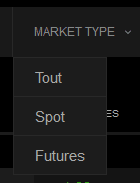
- Market type: Coinalyze gives you the choice of All (Spot + Futures), Spot (the cash market) and Futures (derivative contracts)
Here’s an example where I filtered the display to show BTC Futures on Bybit in USDT:
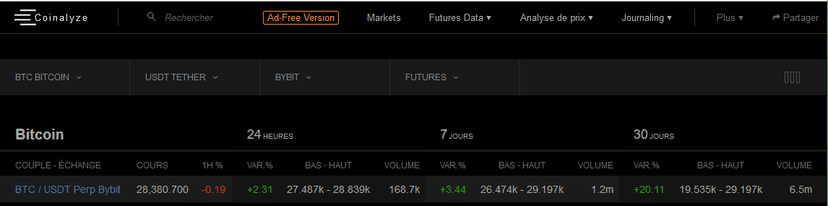
This gives us a summary of what happened over the last 24 hours, 7 days and 30 days for the BTCUSDT pair on Bybit.
Technical Analysis and Price Charts in the “Markets” Tab
Clicking the BTC/USDT pair gives the following chart:
1st block: the chart
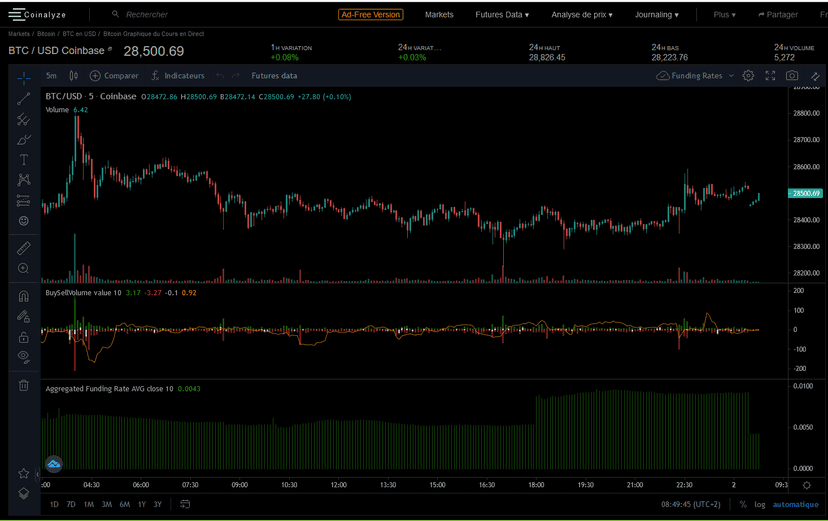
2nd block: right-hand side of the screen
On the right, you’ll find a second block with 5 tabs: Trades, WL (Watchlist), Chat, Stats and News
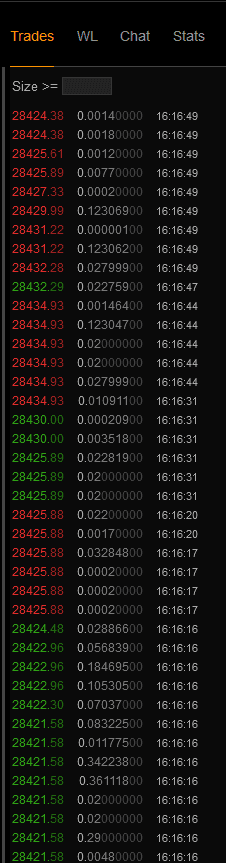
- Trades: in the window that corresponds to “Trades,” Coinalyze shows a 3-column table with the following info: the price of the executed trade, the quantity of the coin traded and the time of the trade. Above the first column, you can adjust the minimum trade size (Size >=).
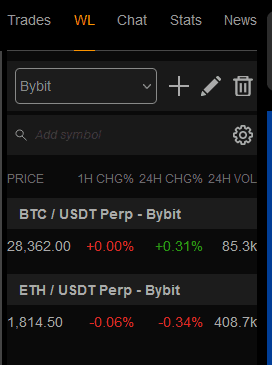
- WL: Watchlist. The “Watchlist” (WL) feature on Coinalyze.net lets users keep a close eye on the cryptocurrencies of their choice.
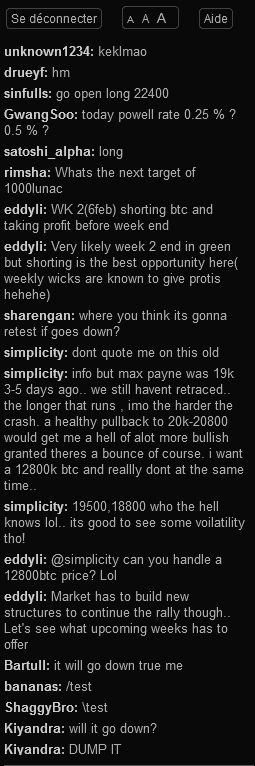
- Chat: a chat space is available to traders when you click “Chat.”
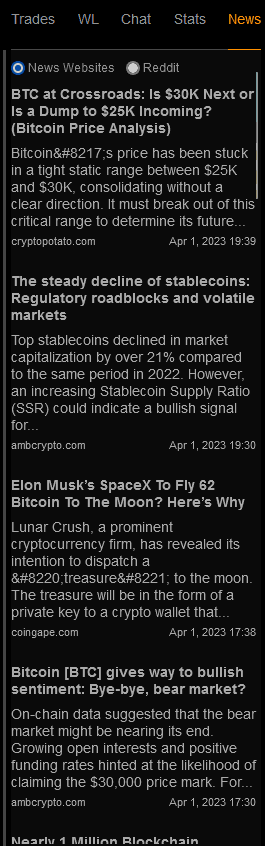
- News
The News tab provides the latest news in English about cryptocurrencies.
Mini-Tutorial for Analyzing Price Charts on Coinalyze
1. Start by selecting the cryptocurrency you want to analyze using the search bar, using the filters (see the previous point) or by browsing the list of cryptocurrencies.
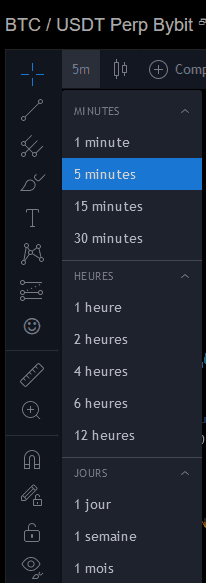
2. Once you’ve chosen a cryptocurrency, click “PAIR-EXCHANGE” in the 1st column on the left to see the price chart. You can customize the format and the time interval used to display the price data. Each candle can represent a time interval ranging from one minute up to one month. You can also go back in time and get a synthetic view of the price action, for example over 3 years (3Y = 3 years).
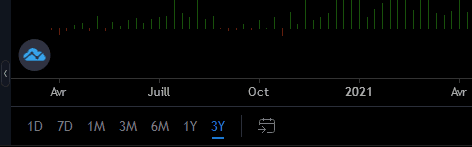
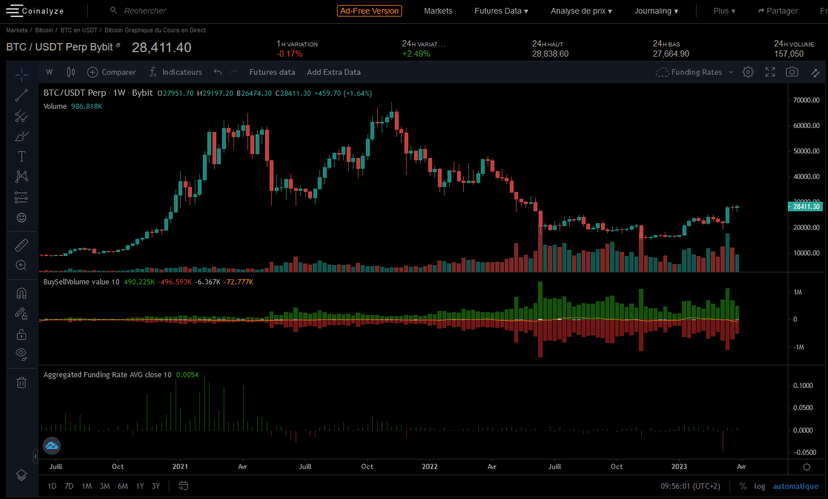
Here’s the result for the BTC/USDT pair in Weekly (here, 1 candle represents one week) over 3 years (3Y):
3. Use the drawing tool to add trendlines, price channels and technical indicators such as moving averages, Bollinger Bands and oscillators.
You’ll find the same tools you’re probably already using on TradingView:
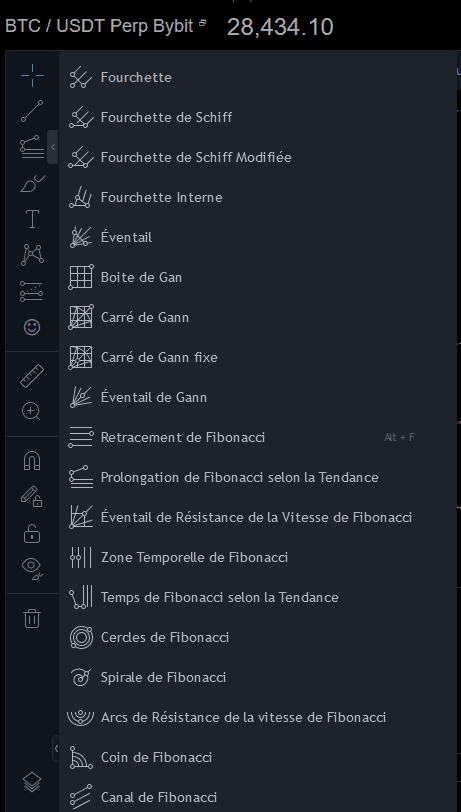
So I encourage you to read or watch our TradingView tutorials to use these very powerful tools more effectively.
4. Use Coinalyze’s specialized indicators and the Extra Data
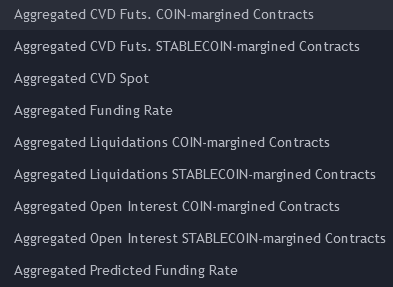
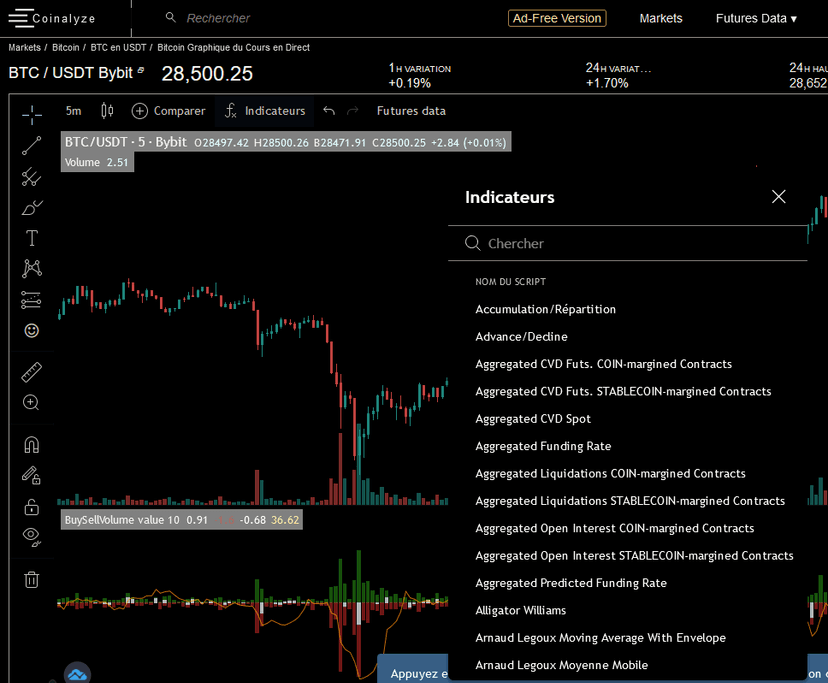
Coinalyze gives you easy access to specialized indicators that aggregate data from the biggest platforms (Binance, Coinbase, etc.). They’re easy to recognize because they all begin with the word “Aggregated.”
Here are the main aggregated indicators Coinalyze makes available, sorted by category:
1. Aggregated Liquidations:
- Aggregated CVD Liquidations Coin-margined Contracts: total amount of liquidations for coin-margined contracts
- Aggregated CVD Liquidations StableCoin-margined Contracts: total amount of liquidations for stablecoin-margined contracts
- Aggregated Cumulative Volume Delta Spot: I’ve dedicated a free trading course to it, and I encourage you to take a look at this technical indicator, which I use more and more!
2. Aggregated Open Interest:
- Aggregated CVD Open Interest Coin-margined Contracts: total amount of open interest for coin-margined contracts
- Aggregated CVD Open Interest StableCoin-margined Contracts: total amount of open interest for stablecoin-margined contracts
3. Aggregated Funding Rate Indicators:
- Aggregated Predicted Funding Rate: aggregated predicted funding rate for all contracts
- Aggregated Predicted Funding Rate Coin-margined Contracts: aggregated predicted funding rate for coin-margined contracts
- Aggregated Predicted Funding Rate StableCoin-margined Contracts: aggregated predicted funding rate for stablecoin-margined contracts
How to Interpret Coinalyze’s Aggregated Indicators?
The aggregated indicators are indispensable tools for any self-respecting trader! They let you track how the markets are moving in real time and make informed decisions (without which turning a profit is impossible).
For example, the Aggregated CVD Liquidations Coin margined Contracts indicator lets you track liquidations of coin margined contracts. The Aggregated CVD Liquidations StableCoin margined Contracts indicator lets you track liquidations of stablecoin margined contracts. These indicators are especially useful for traders who want to follow how cryptocurrency markets are evolving, since they’re known for their volatility.
The Aggregated CVD Open Interest Coin margined Contracts indicator, for its part, lets you track the open interest of coin margined contracts, while the Aggregated CVD Open Interest StableCoin margined Contracts indicator lets you track the open interest of stablecoin margined contracts. These indicators are especially useful for traders who want to follow the long-term trends of cryptocurrency markets.
Lastly, the Aggregated Predicted Funding Rate indicator lets you track the predicted funding rates for coin margined and stablecoin margined contracts. This indicator is especially useful for traders who want to anticipate market moves and make informed decisions accordingly.

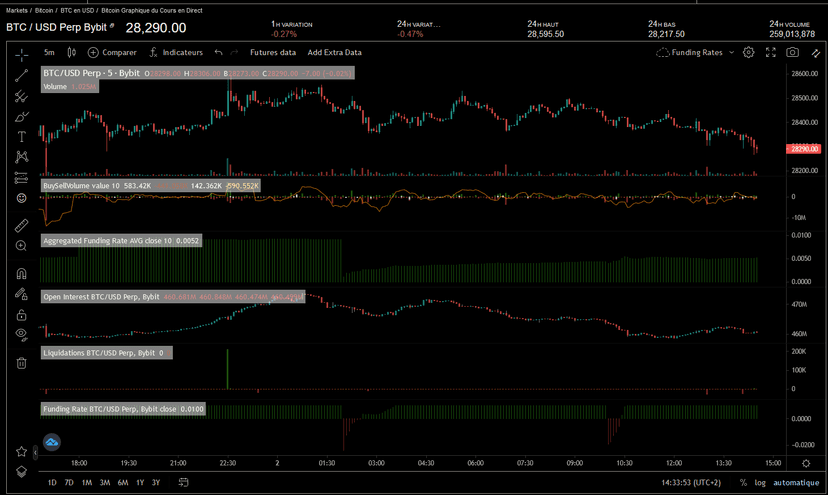
At the top of the chart, below the asset’s price, to the right of “Indicators,” you’ll find two more labels: Futures Data (which you’ll also find in another menu: see below) and Add Extra Data.
By clicking Add Extra Data, you automatically get additional data on the chart: 4 indicators are automatically added to the chart: “Aggregated Funding Rate AVG close,” Open Interest, Liquidations and Funding Rate.
The “Futures Data” Tab
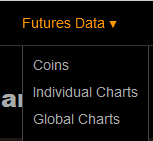
This tab breaks down into 3 submenus: Coins, Individual Charts and Global Charts
The “Coins” Submenu (2.1)
Clicking “Coins” gives you the list of tracked cryptos ordered by their market-cap value: BTC, ETH, XRP, … You can sort the cryptos by other criteria by clicking at the top of each column: PRICE, CHG 24H, etc.
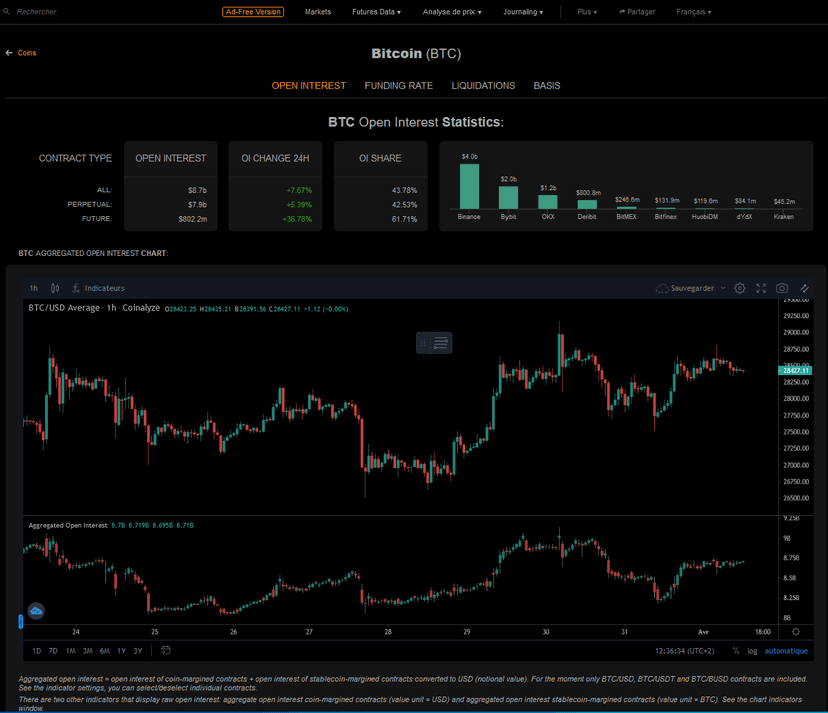
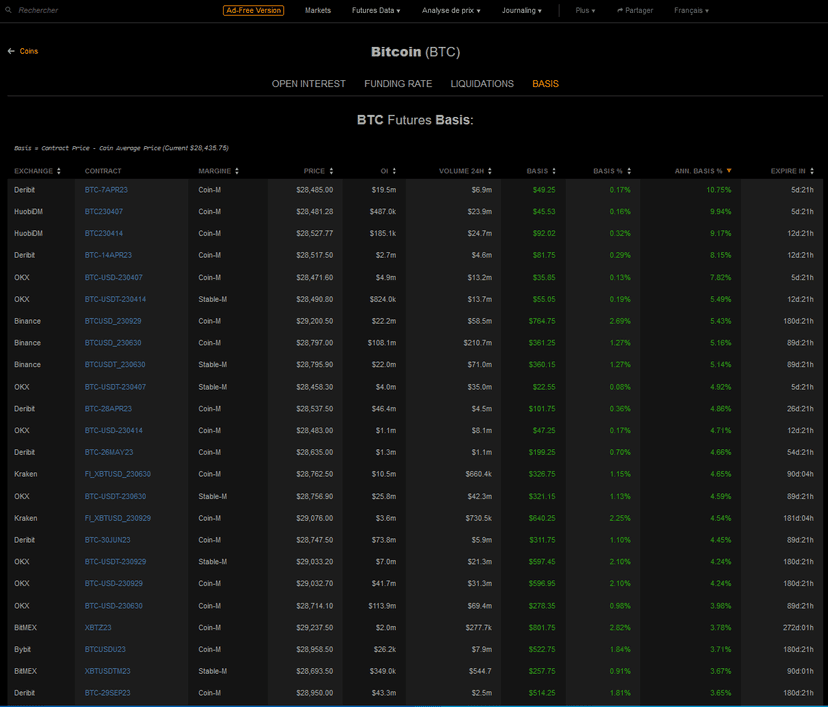
If you click a coin (crypto asset), e.g. BTC, in the left-hand column, you get a table (see below) with more detailed information on the OPEN INTEREST, the FUNDING RATE, the LIQUIDATIONS and the BASIS of the main cryptocurrencies.
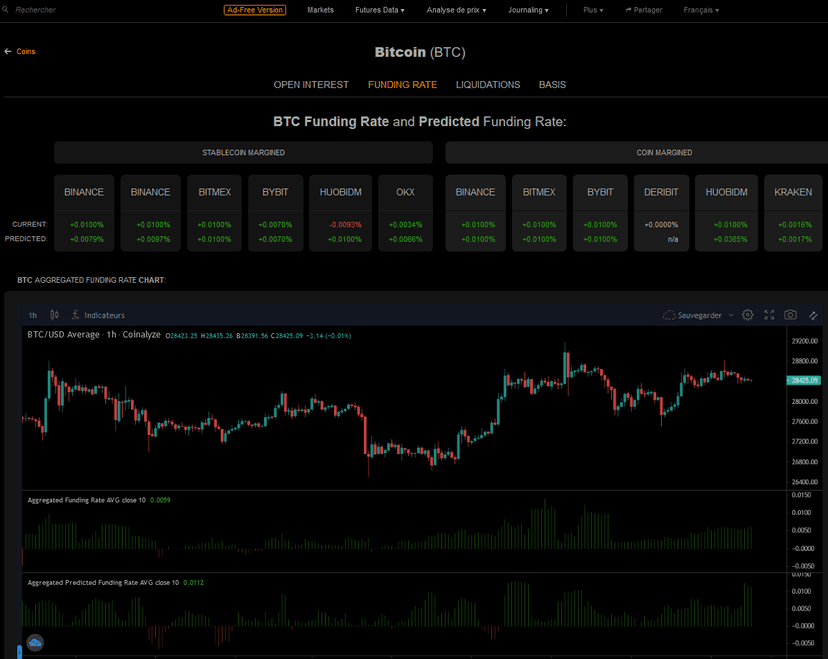
- Funding Rate
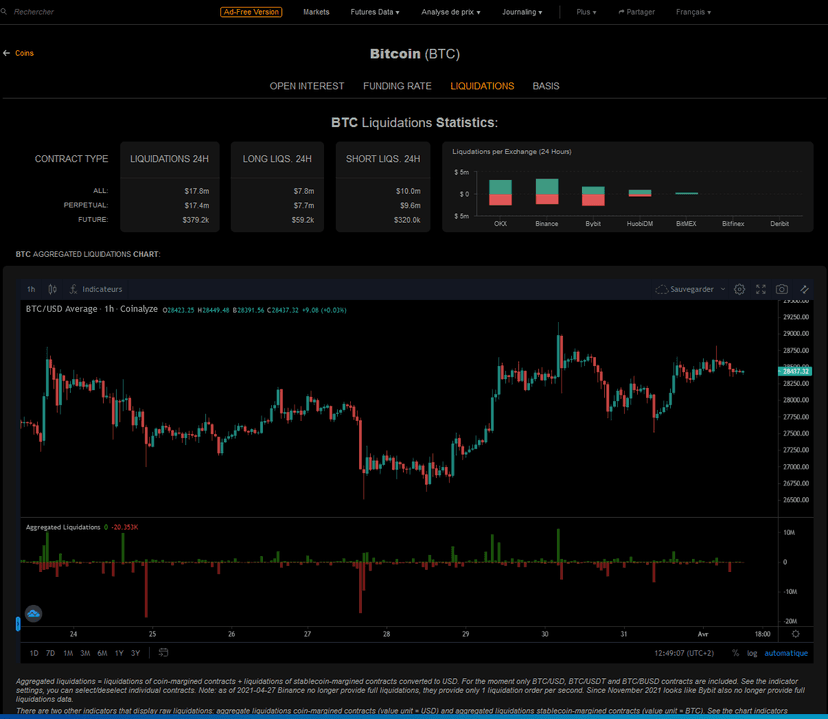
- Liquidations
- BASIS (Basis = Contract Price – Coin Average Price)
The “Individual charts” Submenu (2.2)
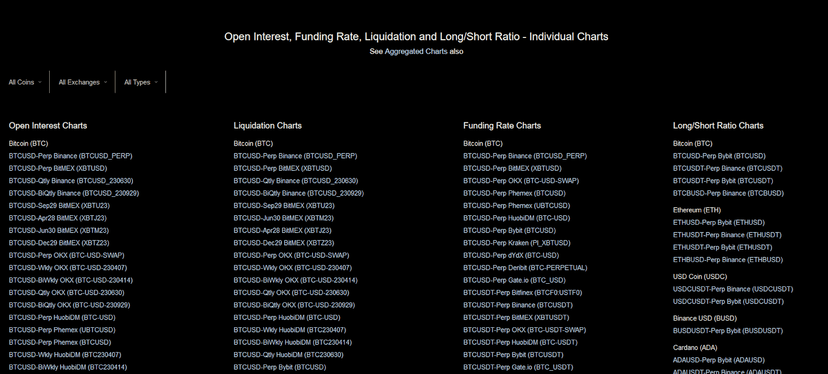
Clicking “Individual charts,” which means “individual (or custom) charts,” gives you the following list, arranged in 4 columns: Open Interest Charts, Liquidations Charts, Funding Rate Charts and Long/Short Ratio Charts. You can filter the data to more easily access what you’re looking for (3 filter criteria: Coins, Exchanges and Types).
The “Global Charts” Submenu
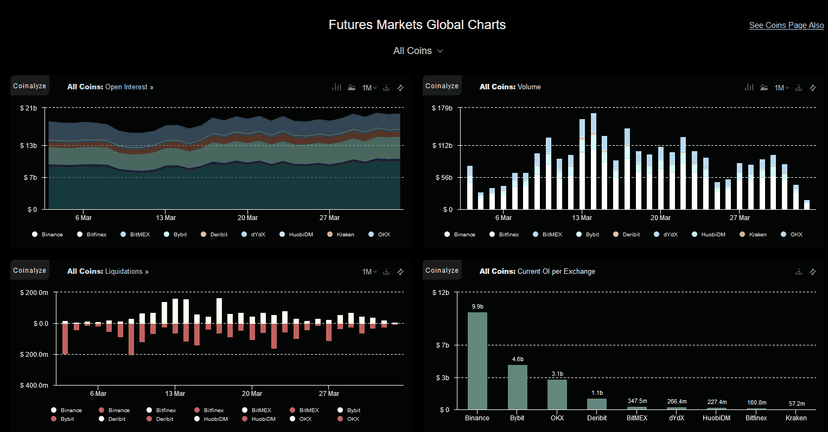
Clicking “Global Charts” gives you data that’s very useful for stepping back and grasping the crypto market as a whole. It covers all the cryptos available on the market and listed by Coinalyze.
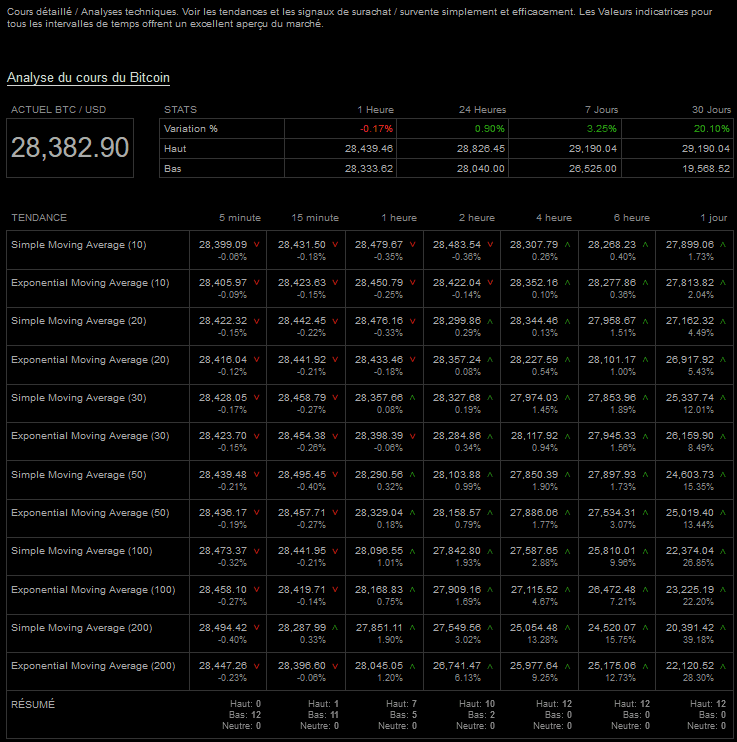
The “Price Analysis” Tab

Hovering your mouse over this tab opens the following menu:
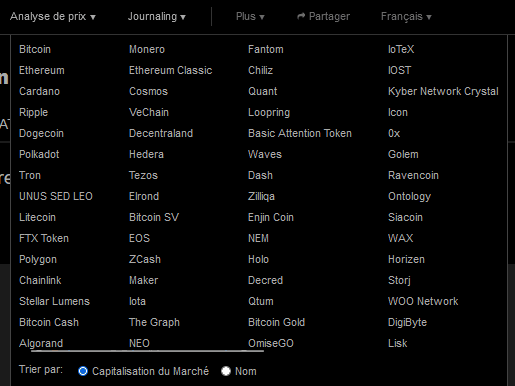
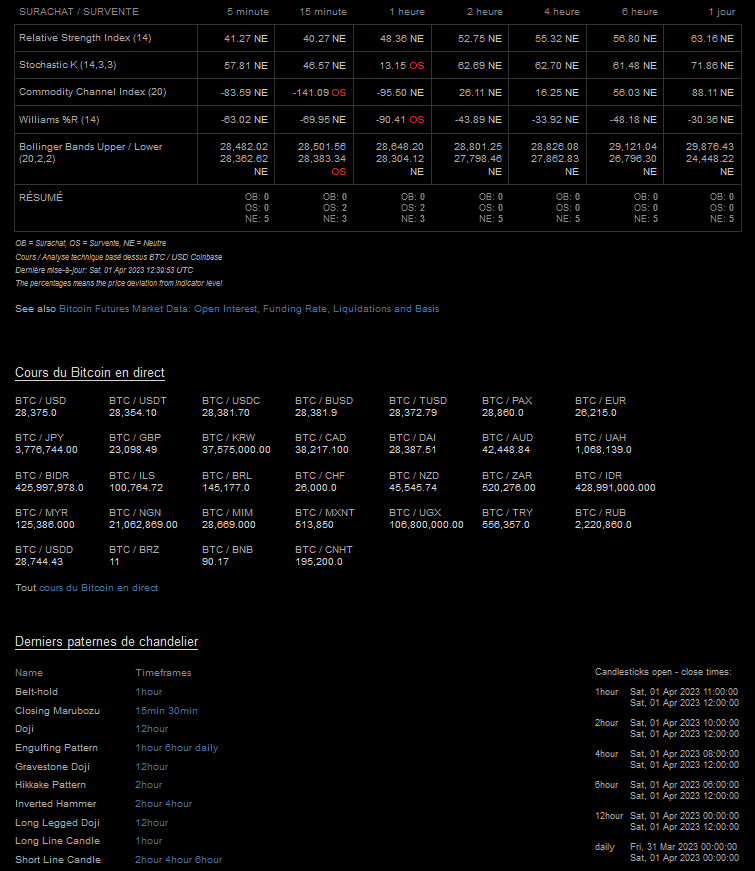
You can then choose the coin you want analysis information on: moving averages (SMA, EMA, RSI, CCI, W%R, …).
At the bottom of the page, you’ll also find Japanese candlestick patterns and the corresponding timeframe.
The “Journaling” Tab
This tab sends you to a Coinalyze partner: CMM = Coin Market Manager
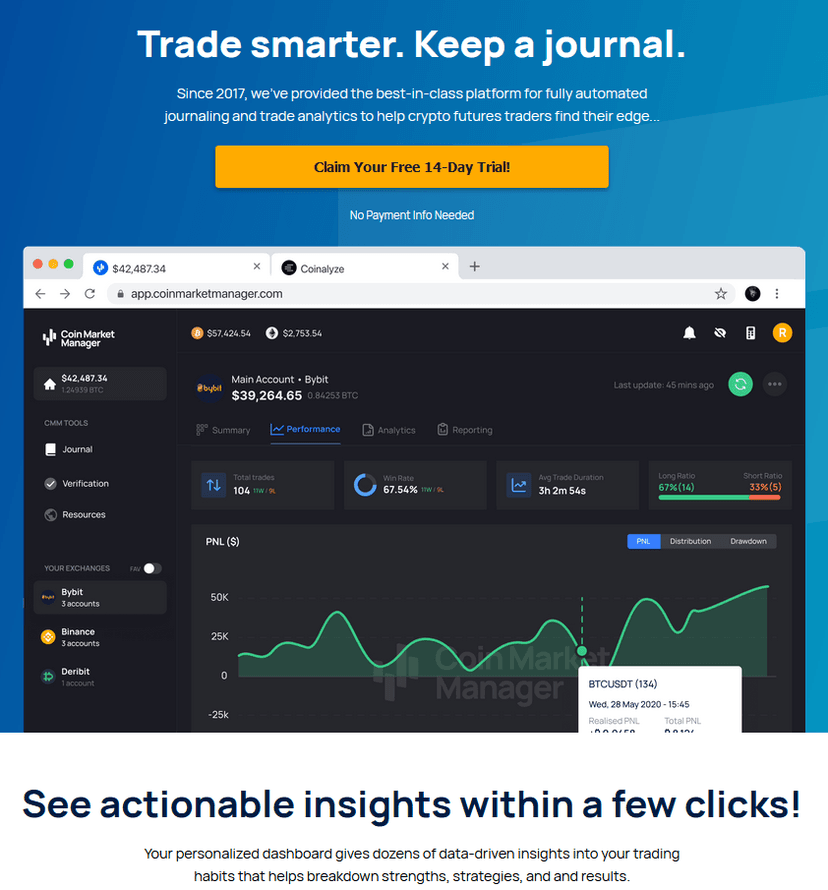
To be completely honest, I haven’t tried it. So I can’t tell you any more about it.
The “More” Tab
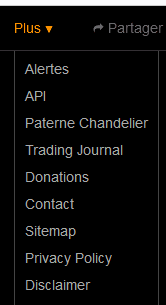
The “More” tab gives access to various submenus: Alerts, API, Candlestick Pattern, Trading journal, Donations, Sitemap, Privacy Policy and Disclaimer.
- Alerts: see above
- API: API stands for “Application Programming Interface.” An API lets applications communicate with one another.
It defines the actions an application can perform and how to perform them. Developers can thus use an API to access the features of a third-party application and integrate it into their own, without having to build every feature from scratch. This saves time and resources while offering a better user experience. APIs are commonly used across many fields, such as social networks, online retail applications, location services, and so on.
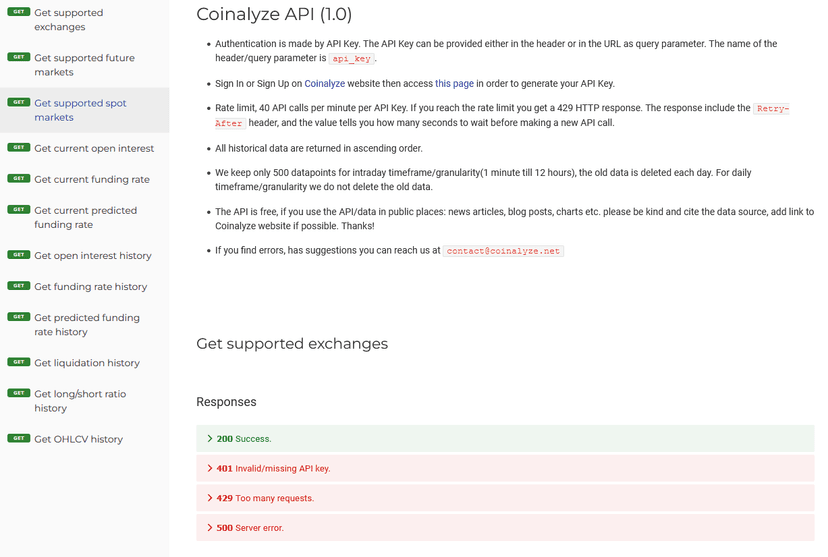
- The Sitemap lets you get an overall view of the Coinalyze site if you want to make sure you don’t miss anything!
The Share Tab
The “Share” tab, as its name suggests, lets you share the current analysis page on FB, Reddit or Twitter.
The Language Tab
Besides French, the site can also be displayed in Korean, English, Russian, German, Dutch, and so on.
Interpreting Aggregated Open Interest
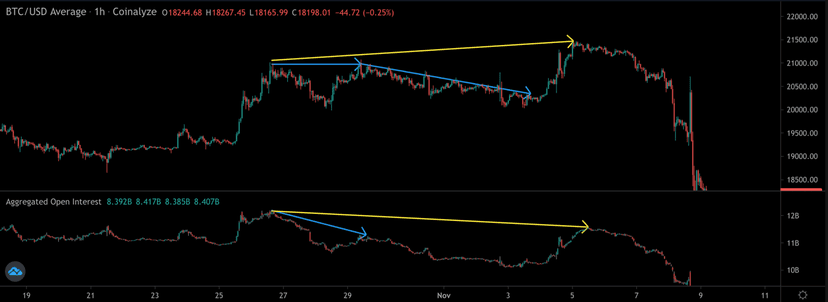
Aggregating Open Interest can be used to gauge the strength of a trend. In the chart below, the blue arrows mark the drop in aggregated open interest when price reached a similar high, which implies that the strength of the move is fading and there isn’t much upside left.
This idea shows up in the chart below. Price falls after the second peak. The yellow lines also point to this trend. While price makes a higher high, aggregated OI makes a lower high, which indicates weakening strength.
This phenomenon is illustrated by the sharp drop in price after the peak.
An image illustrating aggregated open interest is shown below:
We can better understand the global open interest indicator by observing its trend over long periods. For example, the blue line on the bitcoin open interest chart shows a general uptrend. Moreover, the price of BTC seems well supported at the 18.6K level. It also appears that when price reaches its support line, Open Interest does the same, indicating that the markets are stabilizing at 18.6K.
Combining and Interpreting Aggregated Open Interest and CVD
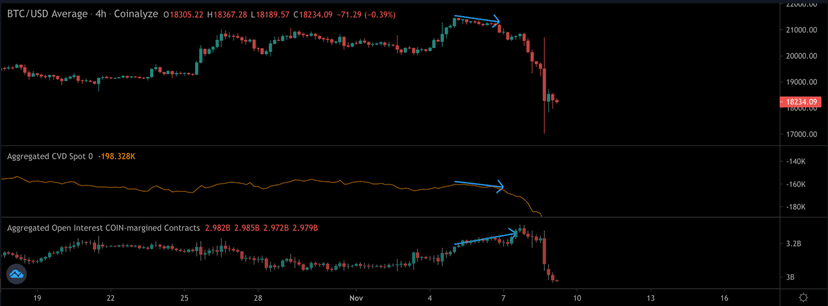
The CVD indicator specifically monitors contracts backed by the underlying asset. It’s particularly well suited to tracking spot and futures transactions. By looking at the CVD indicator and the COIN-margined OI indicator together, you can spot a sharp price drop resulting from a divergence between the two. The CVD indicator falls while the global COIN-margined OI indicator rises, which should lead to a substantial price drop.
This can be read as a sign of large-scale selling of spot flow, as some investors are overconfident in their spot holdings and use them as margin. This can lead to their liquidation and to continued selling of their collateral, so a divergence between the two indicators can be an early warning sign of a possible sharp crash.
Here’s an example in the chart below.
Open Interest on Futures / Stables: a Technical Indicator in Its Own Right?
The indicator we’re talking about is used to measure the contracts that are backed by stablecoins, which make up the majority of them. It’s expressed in COIN. The chart below clearly shows that it can be used to predict periods of high volatility. When the Aggregated Open Interest STABLECOIN-margined indicator spikes, breaks out of a range or heads upward, it usually foreshadows significant volatility spikes, as you can see when price breaks above its Bollinger Bands.
People who want to limit their exposure to market swings or stay delta-neutral can take advantage of this indicator to anticipate periods of extreme volatility.
In short, aggregated open interest indicators, like the aggregated funding rate and the predicted funding rate, let traders analyze the overall positioning of futures and perpetual contracts. They also give a sense of the leverage and the bullishness of the market.
Coinalyze: How I Usually Use It
To prepare my trading sessions, I need two fundamental pieces of information: price and Open Interest. In other words, I look at the price action and the total number of open futures contracts on an asset. That’s the essential part, and I could almost make do with it alone to define my buy and sell signals. That said, you know me — I like to aggregate readings and make them converge.
Open Interest is my martingale. But watch out! OI is far from 100% reliable. In fact, no indicator, taken on its own, can be meaningful. Reading O.I on futures contracts is of interest to me because it lets you interpret what is really going on with liquidations.
Are they enough to have interesting consequences and set off a move?!
For me, Open Interest is a crucial tool in my trading strategy, because it tells me which assets traders are focused on right now.
To get Open Interest data, Coinalyze is my first port of call. I look up the data for each asset and analyze the numbers to see whether there have been any significant moves on the market. I also use the charts to follow how Open Interest is evolving, along with technical indicators to confirm my analysis.
Finally, I plot the support and resistance levels to determine my market entry and exit points. This lets me trade efficiently and profitably.
Conclusion
If you’re looking for a site to monitor the market, Coinalyze.net is one of those tools you absolutely need! And it’s free on top of that … I still can’t believe it!
Thanks to Coinalyze.net, you’ll get access to a unique aggregation of information. In my view, it really is the free tool par excellence, because you don’t even need to sign up! It’s one of the tools I love, along with Basedmoney for example! By the way, let me remind you that I put together specific free courses to master the indicators I use on Coinalyze. The most recent is my course on the Cumulative Volume Delta!
Defining Opportunities with Open Interest

Every guide here is free. Browse the full course and join a community of traders who share ideas every day.