Ichimoku Kinko Hyo means “equilibrium at a glance.” It’s better known as the Ichimoku cloud. It’s a technical indicator from Japan that’s still very popular today. Like the vast majority of technical indicators, the Ichimoku cloud can be viewed on TradingView!
Heads up: this trading course is above all a theory-focused trading course designed to open your mind to methods other than my own: Price Action. Ichimoku never worked for me. That doesn’t mean Ichimoku can’t be a fit for you. If this method and trading strategy is so well known, maybe there are good reasons for that!
In 1969, Mr. Goichi Hosoda, a Japanese journalist, published a meta-indicator designed to provide trend analysis. In short, Ichimoku uses several dynamic lines to deliver information about price structure and the trend. The goal was to read support and resistance levels in order to define buy and sell signals. The aim, of course, is to support traders in their market decisions. Just for curiosity’s sake, picture gathering all that information and analyzing it in an era when the PC didn’t yet exist…
As a reminder, no technical indicator can be read on its own. There has to be confluence across several indicators for the first one to mean anything.
This technical indicator is known for its complexity and can feel intimidating to new traders. That said, like any theory, once it’s spelled out, everything becomes simpler.
Ichimoku: The Indicator’s Components
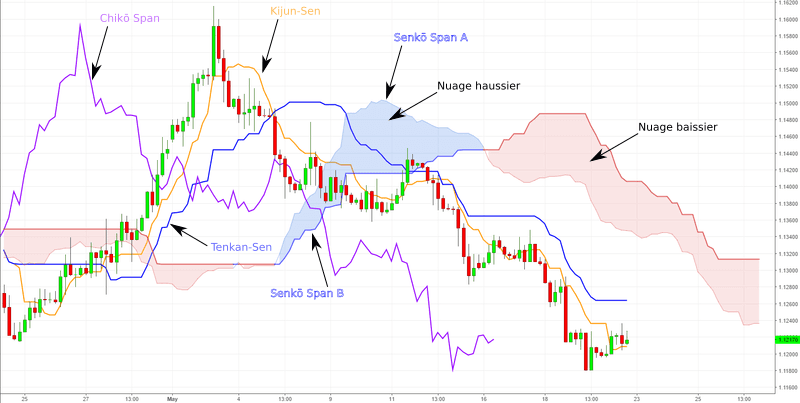
This indicator is made up of a cloud and 5 lines, the cloud being the space that sits between two of those lines. Each of these 5 lines has its own very specific name:
Kijun-Sen
The Kijun-Sen is the base line of the Ichimoku system. It’s every trader’s bread and butter, since an interaction between price and the Kijun-Sen represents equilibrium — often an excellent point to enter a trade in a trending market. It’s a potential support / resistance level and tends to carry more weight than the Tenkan-Sen (conversion line), because it moves more slowly.
H = the highest price over the previous 26 candles.
L = the lowest price over the previous 26 candles.
Kijun = (H+L)/2 = L+(H−L)/2
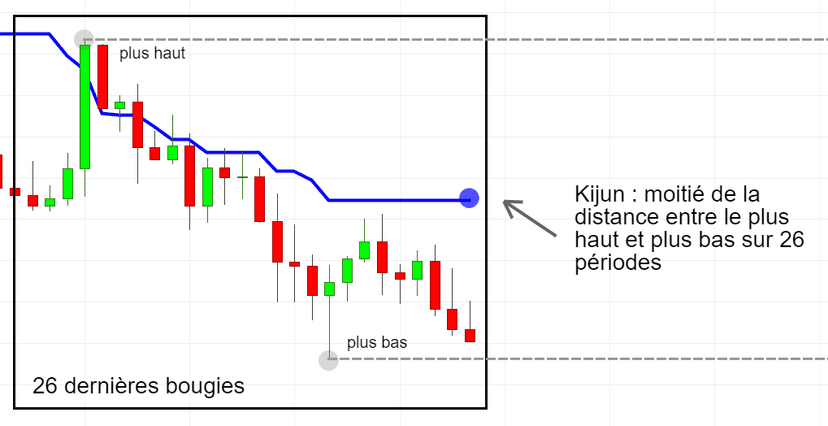
For crypto, you can use 30 candles, or even 60.
Tenkan-Sen
The Tenkan-Sen is the conversion line in the Ichimoku system. Like the Kijun-Sen, the Tenkan-Sen marks a potential support/resistance level. Because it moves faster, it’s often seen as a weaker signal than the Kijun-Sen. It acts as an alert line for the Ichimoku system. If the Tenkan-Sen crosses the Kijun-Sen from below, it signals a bullish TK-Cross, and vice versa for a bearish TK-Cross. The strength of these signals varies depending on where the cross sits relative to the cloud.
Usually shortened to “Tenkan” or TS, this line sits at the midpoint between the high and the low over the last nine periods observed. You can think of it as a kind of “equilibrium price” across 9 periods.
The formula to obtain it is similar to the Kijun; the only difference is the period.
H is the highest price over the preceding 9 candles.
L is the lowest price over the preceding 9 candles.
T e n k a n = (H+L)/2 = L+(H−L)/2
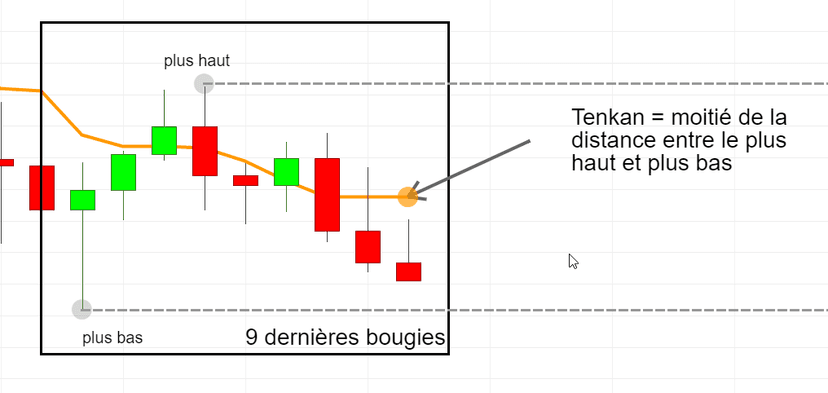
For crypto, you can use 10 candles, or even 20.
Chikō Span
The Chikou Span, also known as the Lagging Span, represents the latest closing price projected twenty-six periods back.
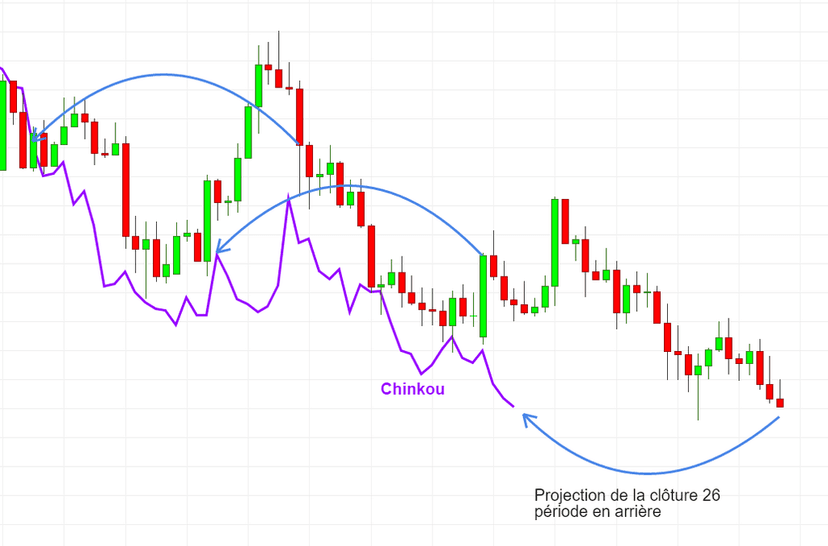
It’s often shortened to “Chikō” or CS. Where the Chikou Span sits relative to price, the cloud, the Tenkan-Sen and the Kijun-Sen can provide information about the strength of the current trend. What’s more, the interactions between the Chikou Span and the other components of the cloud can offer insight into potential support or resistance.
Senkō Span A
The Senkou-Span A is one of the two lines that form the cloud in the Ichimoku system, and it gives traders a preview of potential support / resistance zones projected into the future, offering a rough estimate of where price would trade based on the current trend. It’s calculated as follows:
(Kijun-Sen + Tenkan-Sen)/2 over the last 26 candles.
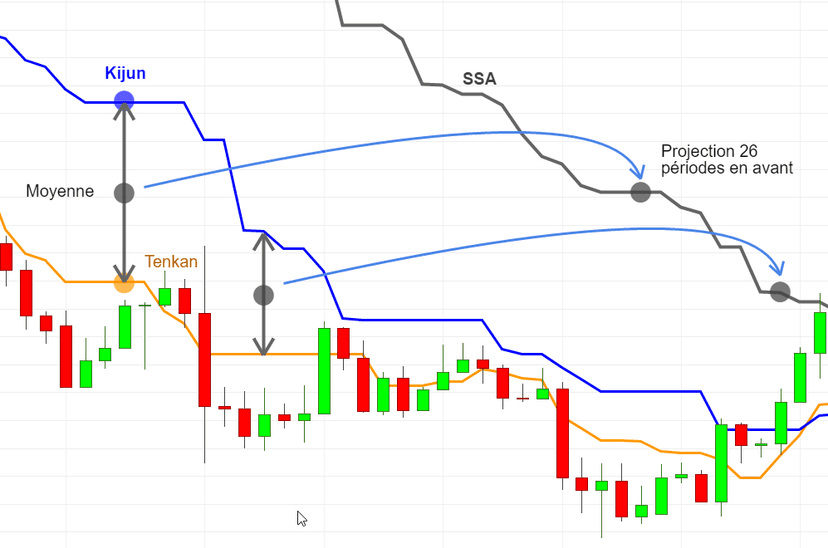
For crypto, you can use 30 candles, or even 60.
Senkō Span B
The Senkou-Span B is the second of the two lines that form the cloud in the Ichimoku system. Just like the Senkou-Span A, it gives traders a preview of potential support / resistance zones projected into the future. It’s a graphical representation of a high and a low drawn from historical data, extended 26 periods forward. The “stronger” line has a longer period and is harder to break through, which makes it more effective as support or resistance.
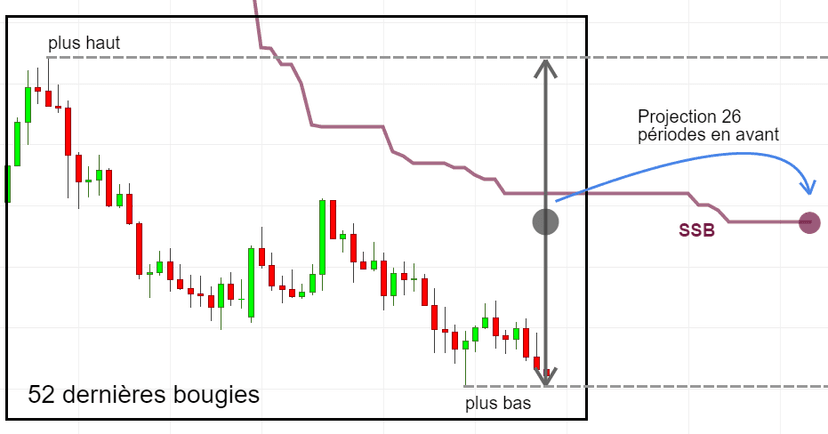
For crypto, you can use the last 60, or even 120 periods, projected 30 periods forward.
The Cloud is bounded by two edges, the Senkou-Span A and the Senkou-Span B. The gap between the Senkou-Span A and the Senkou-Span B forms the cloud, which is bearish or bullish depending on which Span is currently higher. If the Senkou-Span A is above the Senkou-Span B, the cloud is bullish, and vice versa for a bearish cloud.
Ichimoku: Interpretation
The Ichimoku Cloud
When price sits above the cloud, the cloud acts as support, pointing to an uptrend. Conversely, when price is below the cloud, the cloud acts as resistance, signaling a downtrend. The slope of the cloud can serve as a gauge of the trend’s strength.
The thickness of the cloud can provide additional information about the strength of the trend. Traders can adopt different analytical strategies depending on market fluctuations. Your attention should be on the density of the cloud or the levels set by its upper and lower boundaries: (SSA and SSB)
Kijun
Traders use the Kijun to assess the market’s medium-term trend. It’s one of the five key lines of this indicator.
The Kijun is calculated from the arithmetic mean of the highs and lows over the last 26 timeframes. It’s often used to provide buy or sell signals after a consolidation phase. If price is above it, that can indicate a strong uptrend and positive market dynamics. Whereas if price is below the Kijun, that can indicate a strong downtrend and negative market dynamics.
Traders can also use the Kijun to assess support and resistance levels. You’ll notice how useful it is as a support level on long positions. On short positions, it will instead be used as resistance.
In short, the Kijun is a key Ichimoku tool for assessing the direction and strength of the trend. It’s used over the medium term to identify important support and resistance levels.
The Kijun is often used to determine the market trend. If price is above the Kijun, that indicates an uptrend, whereas if price is below the Kijun, that indicates a downtrend.
On top of that, the Kijun can also act as support or resistance. If price bounces off the Kijun after reaching it, that can indicate support and therefore a buying opportunity. Likewise, if price fails to push past the Kijun during a bullish move, that can be read as a resistance level and therefore a potential sell signal.
Tenkan
Interpreting the Tenkan in the Ichimoku system refers to one of the five components of our indicator. The Tenkan-sen, also called the conversion line. It’s calculated by taking the average of the highs and lows over the last nine timeframes.
Interpreting the Tenkan can help identify short-term trends and potential inflection or reversal points. If the conversion line is rising, that indicates a short-term uptrend. If it’s falling, that suggests a short-term downtrend.
What’s more, when the conversion line crosses the Kijun-sen base line to the upside, that can be considered a buy signal. Whereas a cross to the downside is considered a sell signal. A cross between the conversion line and the cloud can also indicate potential support or resistance levels.
It’s worth stressing that interpreting the Tenkan in the Ichimoku system shouldn’t be used on its own. It should be combined with other indicators and technical analysis tools to make informed trading decisions.
Chikō
The Chikō (also called the lagging span) is plotted behind the current price. It serves as confirmation or as a trend-reversal signal.
Interpreting the Chikō is relatively simple. If the Chikō line is above the current price curve, that indicates a strong uptrend. Conversely, if the Chikō is below the current price curve, that indicates the possibility of a strong downtrend. If the line crosses the current price from bottom to top, that’s considered a bullish signal. If it crosses price from top to bottom, that’s considered a bearish signal.
Interpreting the Chikō in the Ichimoku system is often used in combination with the indicator’s other components, such as the Tenkan-Sen, the Kijun-Sen and the Senkou Span. By using these different elements together, the analysis of price levels becomes more precise.
To sum up, interpreting the Chikō can be useful for identifying long-term market trends and key buy and sell signals.
Careful — keep in mind that this indicator shouldn’t be used on its own, but rather in combination with other indicators and market analysis to make informed trading decisions.
Ichimoku: Trading Signals Theory
Buy and Sell Signals
The Ichimoku system uses different trend lines to determine buy and sell signals in the markets. Here are the main signals:
Tenkan/Kijun Cross
This is the basic signal in the Ichimoku system. It’s the intersection between the Tenkan line (red line) and the Kijun line (blue line). A bullish cross (Tenkan above Kijun) is considered a buy signal, while a bearish cross (Tenkan below Kijun) is considered a sell signal.
Kumo Breakout
The Kumo is the cloud that forms between the Senkou A line and the Senkou B line. A Kumo breakout is a powerful signal that points to a change in trend. A bullish breakout occurs when price breaks through the Kumo’s resistance from bottom to top, while a bearish breakout occurs when price drops below the Kumo’s support from top to bottom.
Chikou Span Cross
The Chikou line (green line) is price shifted 26 periods back. A bullish cross of the Chikou line above the price curve is considered a buy signal, while a bearish cross of the Chikou line below the price curve is considered a sell signal.
Senkou Span Cross
This is the intersection between the Senkou A line (orange line) and the Senkou B line (purple line), shifted 26 periods forward. A bullish cross of the Senkou A line above the Senkou B line is considered a buy signal, while a bearish cross of the Senkou A line below the Senkou B line is considered a sell signal.
Ichimoku: Signals and Possible Confluences
To avoid as many false signals as possible, whatever the method or strategy, it’s always recommended to cross-check and bring your readings, signals and indicators into confluence, so you come away with rock-solid evidence to justify your decisions!
You need to confirm the Ichimoku system’s buy and sell signals with other technical indicators.
Indicators Compatible with Ichimoku
Moving Averages
Moving averages can be used to confirm the trend direction indicated by the Kumo cloud. If price is above the 200-day moving average and the lagging span is above it too, that can confirm a potential buy signal.
RSI, or Relative Strength Index
The RSI can be used to confirm buy and sell signals. If the RSI is overbought and price is touching the upper resistance of the cloud, that could be a potential sell signal.
MACD, or Moving Average Convergence Divergence
The MACD can be used to confirm buy and sell signals. If the signal line crosses the MACD line to the upside and price is above the base line, that could be a potential buy signal.
The Chop Index
This is an indicator that measures market volatility by comparing closing prices with those of the trading range. When the chop index is high, it indicates strong volatility and an unstable trend. In that case, it’s best to wait for the chop index to drop before making a trading decision using Ichimoku signals.
Open Interest
Open interest (OI) is an indicator that measures the total number of contracts (buyers and sellers) that are open in the market. It can be used to confirm the trend direction in technical analysis. For example, when open interest rises and price is in an uptrend, it means the trend is being supported by investors entering the market. In that case, it’s advisable to wait for open interest to rise before taking a long position using Ichimoku signals.
Ichimoku: Tips to Avoid False Signals
Identify the Trend
Before using the Ichimoku indicator, it’s important to know which direction the trend is in. The indicator can help identify trend reversals, but that shouldn’t be the only factor you rely on.
Use the Indicator’s Different Components
The Ichimoku indicator is made up of several components, such as the conversion line, the base line, the cloud and the lagging span. It’s important to use all of these components to confirm signals and avoid false signals.
Use Higher Timeframes
Longer time intervals can help filter out false signals. For example, if you use a daily chart, you can filter out the false signals that appear on shorter time intervals like hourly charts.
Avoiding false signals in the Ichimoku system takes a bit of patience and common sense. It’s important to confirm your signals and bring them into confluence with other technical indicators, to use all the components of the Ichimoku indicator, and to use higher timeframes to filter out false signals.
All in all, by using these technical indicators alongside Ichimoku, you can better confirm buy and sell signals and make more informed trading decisions. That said, it’s important to note that these indicators shouldn’t be used on their own, but alongside other technical indicators and a thorough Price Action analysis of the market in question.
So it’s important to use several technical indicators to confirm the Ichimoku system’s buy and sell signals. This can help you avoid false signals and strengthen your confidence in your trading decisions.
Ichimoku: Trading Strategies
A few common strategies for using Ichimoku:
1. Identify the trend: The first thing to do is identify the direction of the trend using the Kijun-Sen line and the Tenkan-Sen line. If the Kijun-Sen line is rising and the Tenkan-Sen line is above the Kijun-Sen line, that indicates an uptrend. If the Kijun-Sen and Tenkan-Sen lines are falling, that indicates a downtrend.
2. Use the conversion line and the base line: The conversion line and the base line are also important for identifying entry and exit points. If the conversion line crosses the base line to the upside, that indicates a buy signal. If the conversion line crosses the base line to the downside, that indicates a sell signal.
3. Use the Ichimoku cloud: The Ichimoku cloud is an indicator that measures market dynamics and can also help you make trading decisions. If the cloud is green, that indicates an uptrend, and if the cloud is red, that indicates a downtrend. Traders can also use price’s position relative to the cloud to determine entry and exit points.
4. Use support and resistance levels: Support and resistance levels can be determined using the Tenkan-Sen and Kijun-Sen lines. If price moves above these lines, that can be a sign of resistance. If price moves below these lines, that can be a sign of support.
It’s important to remember that these strategies don’t guarantee success, and that it’s important to exercise caution and discipline when trading. Traders should also use stops as well as limits to reduce potential risks.
That discipline starts at execution: entering an Ichimoku signal without knowing how much to risk defeats the purpose. On MT4/MT5, the Trade Assistant add-on calculates your position size from the stop, before every order.
Ichimoku: My Take and Conclusion
In conclusion, for some people the Ichimoku system is a valuable tool when it comes to technical analysis. That said, as I keep reminding you, it never worked for me.
In summary, the Ichimoku cloud offers a complete analysis of the market’s medium-term trend using five key lines, of which the Kijun is one of the most important. The Kijun provides buy or sell signals after a consolidation phase and can be used to assess important support and resistance levels.
By using Ichimoku, traders can get a relatively clear overview of the market situation and thus operate more or less effectively in the markets. However, it’s important to understand that Ichimoku is a complex tool that requires a certain amount of experience to use effectively. So traders should take the time to learn how to use Ichimoku properly before integrating it into their trading strategy: Backtesting and Paper Trading
Every guide here is free. Browse the full course and join a community of traders who share ideas every day.