This introduction to Elliott Waves is meant to open your mind to methods beyond pure Price Action. Even though the usual cycles on the crypto market are currently broken by the news flow, it’s sometimes worth getting to know new approaches to broaden your horizons and maybe even find fresh opportunities. Before anything else, I want to stress that this is only a quick theoretical overview; this guide is meant to be expanded soon. What’s more, while I regard Wyckoff as a mentor, the same can’t be said of Elliott. Finally, if chart patterns and trading setups interest you, I’ve also written a course on pattern trading that brings together the few chartist setups I actually use!
Ralph Nelson Elliott developed the Elliott Wave theory in the 1930s.
Elliott believed that the stock markets, which you might assume behave in a somewhat random and chaotic way, actually move according to repetitive patterns.
In this introduction to Elliott Waves, we’ll see how Ralph N. Elliott moved from theory to practice!
Elliott Wave theory is a form of technical analysis that looks for recurring price patterns linked to repetitive behavior in sentiment and in the psychology of traders and investors.
This theory identifies impulse waves that establish a pattern and corrective waves that push against the overall trend.
Each set of waves is nested within a larger set of waves that follow the same impulse-and-correction pattern. This amounts to a fractal approach.
Elliott Waves: the Theory
Elliott claims that the price of an asset depends primarily on the fluctuations of mass psychology. In theory, this shows up as recurring fractal patterns, or “waves,” on the financial markets.
Elliott’s theory bears some resemblance to Dow theory, since both recognize that stock prices move in waves. However, because Elliott also acknowledged the “fractal” nature of the markets, he was able to break them down and analyze them in far greater detail. Fractals are mathematical structures that repeat endlessly at ever-smaller scales. Elliott found that the price patterns of stock indices were structured in the same way. He then began to study how these repetitive patterns could be used as predictive indicators of future market moves.
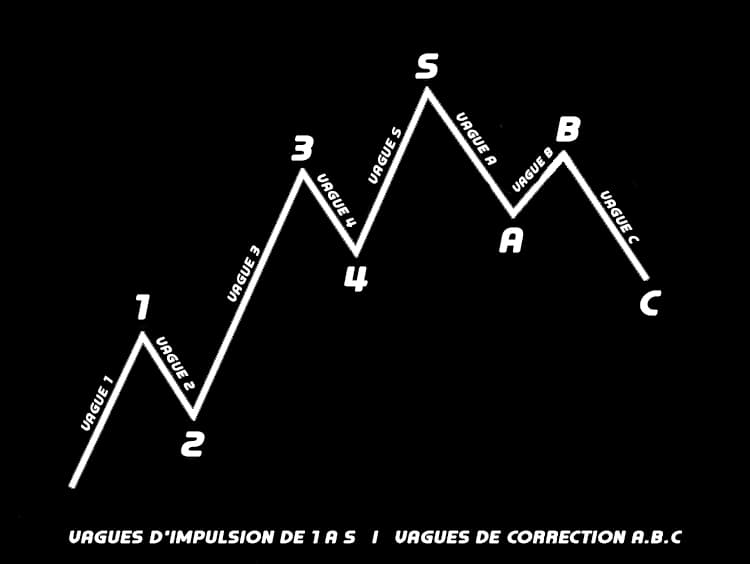
How to Predict Price with Elliott Waves
Elliott makes detailed market predictions based on reliable characteristics he discovered in the wave patterns.
An impulse wave, which moves in the same direction as the overall trend, always shows five waves in its pattern.
A corrective wave, on the other hand, moves in the opposite direction to the main trend. On a smaller scale, within each of the impulse waves you can once again find five waves.
In fact, this pattern repeats endlessly at ever-smaller scales.
Elliott is said to have discovered this fractal structure on the financial markets back in the 1930s. Yet it was only decades later that scientists recognized fractals and proved them mathematically.
On the financial markets, we know that “what goes up must come down,” because an upward or downward price move is always followed by a counter-move. Price action breaks down into trends and corrections. Trends point to the main direction of price, while corrections run against the trend.
How to Interpret Elliott Waves
Elliott Wave theory is interpreted as follows:
1. Five waves move in the direction of the main trend, followed by three corrective waves (a total 5-3 move). This 5-3 move then becomes two subdivisions of the next wave one degree higher.
2. The underlying 5-3 pattern stays constant, although the duration of each wave can vary.
Let’s look at the following chart made up of eight waves (five clearly up and three clearly down) labeled 1, 2, 3, 4, 5, A, B and C.
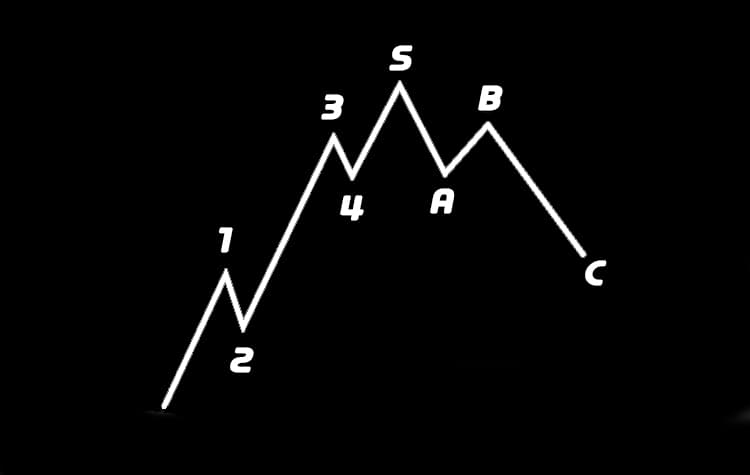
Waves 1, 2, 3, 4 and 5 form an impulse, and waves A, B and C form a correction. The five-wave impulse in turn forms wave 1 at the higher degree, and the three-wave correction forms wave 2 at the higher degree.
The corrective wave normally consists of three distinct price moves: two in the direction of the main correction (A and C) and one against it (B). Waves 2 and 4 in the diagram above are corrections. These waves generally have the following structure:
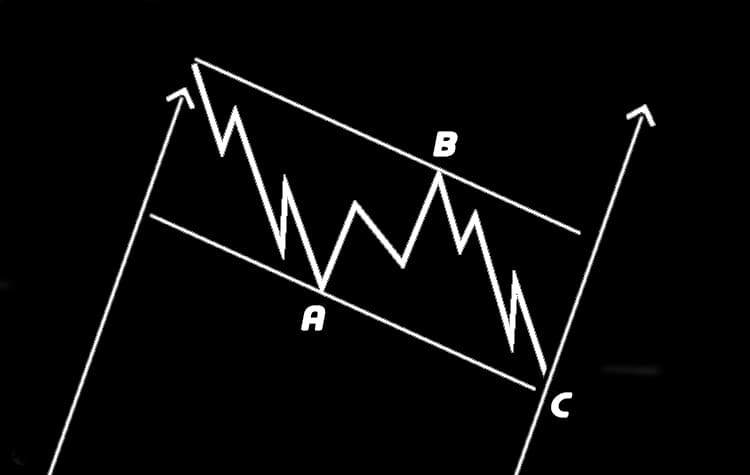
Notice from this diagram that waves A and C move in the direction of the trend at a lower degree and are therefore impulsive, so they can be broken down into 5 waves.
On that same lower scale, wave B, by contrast, is counter-trend: corrective and made up of three waves.
A series of impulse waves, followed by a corrective wave, forms one Elliott Wave degree made up of trends and counter-trends.
Unlike the theory and what you can see in the diagrams above, the five motive waves aren’t always clearly up, and the three corrective waves aren’t always clearly down. When the higher-degree trend is down, for example, the five-wave sequence is down too.
The Different Degrees
Elliott identified nine wave degrees, which he labeled as follows, from largest to smallest:
- Grand Supercycle | several centuries
- Supercycle | several decades (between 40 and 70 years)
- Cycle | from one to several years (or even several decades, according to an extension of Elliott’s work)
- Primary | from a few months to several years
- Intermediate | from a few weeks to several months
- Minor | a few weeks
- Minute | a few days
- Minuette | several hours
- Subminuette | several minutes
Elliott Waves match the concept of a fractal. As a result, wave degrees theoretically extend ever larger and ever smaller beyond those listed above.
For example, to put the theory into practice in everyday trading, a trader can spot an upward impulse wave, take a long position, then sell or short-sell once the pattern completes five waves and a reversal is imminent.
Why All the Enthusiasm?!
In the 1970s, the principles behind Elliott Waves gained popularity thanks to the work of Robert Prechter and A.J. Frost.
In a book now regarded as a classic, Elliott Wave Principle: Key to Market Behavior, the authors predicted the bull market of the 1980s.
Later on, Prechter went on to anticipate and recommend selling a few days before the 1987 crash…
Fans of this theory like to point out that a market isn’t easy to anticipate simply because of its fractal nature.
On that note, scientists agree that a tree is a fractal, but that doesn’t mean you can predict the path of each of its branches.
In terms of practical application, the Elliott Wave principle has its supporters and its critics, like every other analysis method. So it’s up to you to make up your own mind, because personally I’ve never really found it worthwhile.
One of the main weaknesses of Elliott Waves is that it’s easy to question the reading of the waves on the charts rather than the theory itself.
What’s more, the interpretation of degrees and cycles can be confusing because their definitions are very loose.
Indeed, there’s a great deal of freedom in interpreting how long a wave takes to complete.
That said, the traders who subscribe to Elliott Wave theory defend it passionately. Perhaps rightly so; I couldn’t confirm it from my own experience.
On top of that, the cycles we’re used to seeing on the BTC chart appear to be broken … As a result, using a cyclical approach, more or less removed from Price Action, is becoming increasingly dangerous in my view.
Every guide here is free. Browse the full course and join a community of traders who share ideas every day.