Technical analysis is a tough subject… Getting two accurate forecasts in a row doesn’t make you an ace… Far from it! Here’s a brand-new trading & crypto course, now available to you for free!
It’s not a simple topic, which is why I’d first encourage you to work through the mistakes to avoid, so you can then focus on best practices.
When you’re starting out… it’s all about knowing where to begin when you read a technical analysis; it can feel almost intimidating, because on social media everyone throws in their two cents and you quickly get lost!
There’s no single method for doing a TA; there’s no magic formula out there to reach a 100% success rate — it simply doesn’t exist! The only “near” certainties you’ll spot on the subject are the mistakes to avoid!
Heads up! The goal of this article is to open your mind to the topic of TA. If you genuinely want to get started, I encourage you to follow my technical analyses regularly and try to recreate them by deriving micro trading plans. Plenty of platforms also let you check your setup(s) against the price over previous months or years. Be careful, though — a setup is never eternal…
In this article, I’ll walk you through 5 mistakes you absolutely must avoid when doing your own technical analyses. I’ll also share my experience to save you precious time! This article isn’t exhaustive, but it makes an excellent entry point — or a great refresher — to dive into or get back into the subject of technical analysis.
So here are 5 mistakes I would have particularly appreciated being warned about before I started doing my own TAs…
1. Using only low timeframes
Focusing only on lower timeframes is a classic yet very common mistake. It’s essential to know how to distinguish between the timeframes I call micro (2h, 1h, 15m) and the ones I call macro. It’s also crucial to understand the context of the “macro” timeframe before turning to the structure and context of the “micro” timeframes.
Example of macro and micro timeframes for swing trading: Macro = weekly / daily TF / Micro = 4h TF
Start with macro weekly timeframes and zoom in afterward! Opening a chart and switching to a daily or weekly TF view lets you immediately get a feel for the current trend and the price history. That’s no small thing when you’re kicking off a TA.
Using higher timeframes will make your job far easier when it comes to defining long-term trendlines, critical tipping points, or simply your levels.
My tip: Systematically start on the higher TFs and zoom in afterward.
2. Treating support and resistance as precise levels
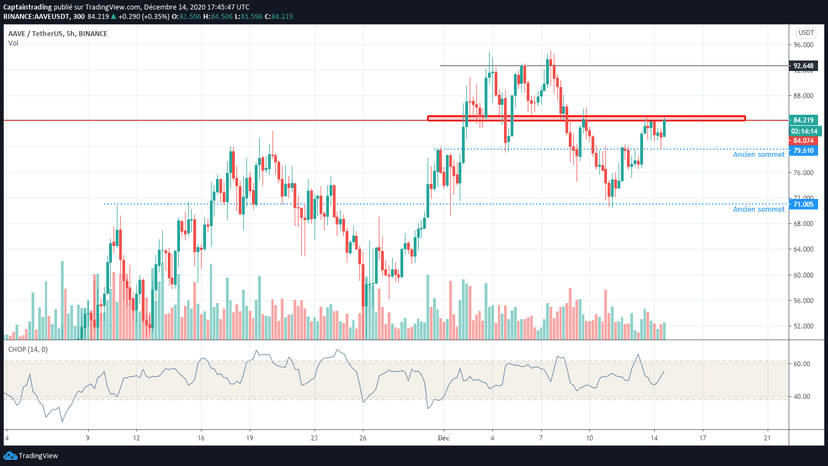
Support and resistance should be treated as more or less wide price zones. Above all, you must not draw thin, precise lines, because that undermines your plans very quickly…
It’s always good to think in terms of a “price zone” rather than an exact price when defining your support and resistance, so you don’t slip into an all-or-nothing mindset that reasons in absolutes: a plain “yes” or “no”… Placing a trade obviously depends on a multitude of factors and not just a single zone, hence the importance of adding nuance around these support, resistance, or even congestion zones.
Typically, if you keep too precise an idea of your resistance and support zones, you’ll set yourself up as an easy target for the whales hunting stops…
What does that mean?! Here I’m talking about the large orders capable of temporarily flipping a trend, making you believe your forecasts are wrong so as to force you out — most often automatically. Then the next day, you realize that with just a few more euros of leeway, you’d have pulled off a wonderful trade… A classic! Think back over these past few days and reread this second paragraph…
My tip: Be strict when defining your levels, but be flexible when price flirts with them. Give yourself a real margin of error, always in line with your risk management, so you can last and improve your win rate! This lack of flexibility made me miss quite a few opportunities in the past — don’t make the same mistake…
3. FORCING AND MODIFYING a plan to justify a setup.
There’s no point cheating with the numbers and with your plan… If I’m making this remark, it’s from experience!!! Every tip I give comes from lived experience and common mistakes. Forcing a plan is frequent. You’ll often see TAs on social media expressing feelings of certainty… Be wary! A price always has several possible outcomes; certainty has no place there, and a plan B is essential.
If you spot a clean setup, you won’t need to force it by adjusting your criteria. That said, it’s important to understand that no setup succeeds 100% of the time, which is why it’s important to give yourself a genuine margin of error, as noted in the previous paragraph.
On top of that, you also need to understand that patience is one of the qualities of a good trader. A widespread mistake is to hunt at all costs for THE setup on a crypto you like… Don’t do it! Be patient; “doing nothing” is actually a big part of a trader’s job. Sometimes you have to wait weeks to see an anticipated setup trigger…
As a beginner, you’ll clearly miss opportunities — and that’s normal! Stop thinking about the missed gains and instead think about what you could have lost with a stop that’s too tight, for example… It’s far better to miss a trade and make no money than to force a trade and lose money; there’s no debate.
4. Misusing indicators
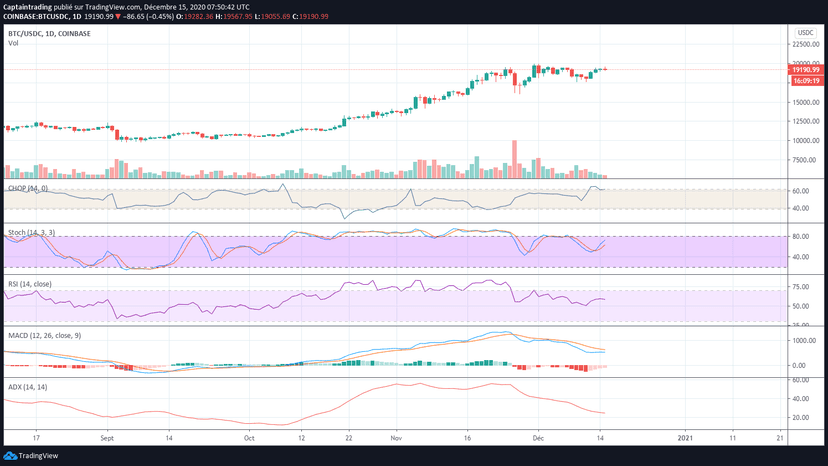
When you’re starting out, it’s very easy to misuse indicators. You lean on them like a walker to make up for your inability to make your own decisions and define your own setups.
It’s easier to blindly trust an indicator than to trust yourself.
In my view, you should first start by getting comfortable with “naked” charts — free of any indicators. Then you can consider adding one or more indicators later on. But without a real understanding of price and trend, it’s bound to be counterproductive.
Besides, stacking indicators makes no sense. The point is to find real meaning in them so you can spot a trend or confirm it. A single indicator can’t confirm a trend, 2 can refine it; whereas a genuine confluence of indicators will let you trigger your plans!
Don’t get me started on the chartists who slap the Ichimoku cloud onto EVERYTHING when they’re incapable of defining their own support and resistance…
My tip #1:
First, make the effort to get comfortable with price movements. Then gradually introduce indicators to define your setups and master them one by one. Understand the calculations hidden behind each indicator before granting it your precious trust. The classic mistake is jumping from one indicator to another because the current one doesn’t work the way you wanted. This habit will keep you from knowing an indicator inside out — which is essential for reading it effectively.
Tip #2: Price and volume are the best indicators.
5. Limiting yourself to a handful of approaches
Become a master of the approach you choose! It’s important to make the most of a setup the way it should be! “Never change a winning team…”.
The classic mistake is jumping from setup to setup without having perfectly mastered a single one. Since it didn’t work out for you, you move on to the next magic method, and so on.
Until you’ve understood exactly why it didn’t work, I’d advise against changing it. If you chose it in the first place, it wasn’t for nothing. It’s not working.
For example, say I post a TA with a plan you didn’t understand. Jumping into the plan that goes with it is a very bad idea… It’s almost a guaranteed failure.
I know it’s tempting to just follow me, especially after landing a trade thanks to one of my tips, but you’ll quickly find that my win rate isn’t 100%.
I sincerely believe that once you’ve got the basics of Price / Volume chart reading down, you’ll be able to calmly define your support and resistance zones. After that, it’ll be about mixing approaches and picking the best one depending on the assets you want to take on, through the lens of your own style!
In the past, I was convinced that chart patterns — or Ichimoku — were the absolute best, until I experienced it firsthand and started trading by cleanly using my own levels…
Now that I’m comfortable with all these methods, I can bring them into confluence in a coherent way.
There’s another significant benefit to varying your method: you’ll be able to put yourself in the shoes of different traders and open your mind to other methods.
My tip: Once you’ve mastered the basics, I encourage you to test different approaches and methods! But be careful… testing doesn’t mean 3 or 4 trades and then on to something else.
Testing is done on a sample of at least 30 trades. It’s important to try different approaches, but it’s also common not to have explored them deeply enough.
Don’t forget: risk management is the key to success in trading, and here’s my full video on the subject
Happy trading, everyone!
Every guide here is free. Browse the full course and join a community of traders who share ideas every day.