Wednesday, October 14, 2026, 2:30 p.m. in Paris. The Bureau of Labor Statistics, the statistical agency of the US Department of Labor, publishes the September consumer price index: +0.6% over the month, +3.7% over the year. Gasoline, up 9.1% in the month, accounts by itself for more than half of the increase. But “core” inflation, which excludes food and energy, rises only 0.3%, as in August. One number, two readings, and markets that have to make up their minds within seconds: welcome to the world of economic releases.
These releases are back at center stage. Since Kevin Warsh became Fed chair on May 22, 2026, the US central bank no longer announces its next moves: out goes forward guidance, in come statements half as long. So it is up to the market to guess what comes next, number after number — and you can see it live: the 2:30 p.m. releases are shaking the dollar, rates, indices, and crypto again. This guide teaches you to read CPI, PPI, PCE, and the jobs report (NFP), to understand what makes prices react, and to watch for the numbers on Forex Factory without getting trapped by volatility. It is current as of October 14, 2026, with the official calendar through the end of December.
Key takeaways:
- An economic release is an official statistic published on a fixed date and time. In the United States, the most closely followed ones come out at 8:30 a.m. New York time, which is 2:30 p.m. in Paris — 1:30 p.m. during the out-of-sync weeks, when one of the two countries has already changed its clocks and the other hasn’t yet.
- CPI measures the prices consumers pay, PPI the prices producers sell at, PCE is the index on which the Fed sets its 2% target, and NFP counts the jobs created in the month.
- The market doesn’t react to the number, but to the gap from the consensus, the “Forecast” column on Forex Factory. A core CPI of +0.3% is a bad surprise if +0.2% was expected, and good news if +0.4% was expected.
- Since Kevin Warsh, the Fed no longer says in advance where its rates are heading. Warsh judges by trends rather than by a single number, but without forward guidance, it is up to the market to reconstruct those trends, release after release: each number carries more weight.
- On Forex Factory, keep high impact only (the red folder), set the time zone to Paris, and remember that green means “good for the currency”: a green CPI supports the dollar… and often weighs on stocks and Bitcoin.
- At 2:30 p.m., the spread widens and slippage lurks: reduced size, a stop placed before the release, or patience until the first candle closes.
What Is an Economic Release?
An economic release is the publication of an official statistic, on a date and at a time set months in advance. In the United States, these numbers come from federal agencies: the Bureau of Labor Statistics (BLS) for prices and employment, the Bureau of Economic Analysis (BEA) for GDP and the PCE index, and the Census Bureau for retail sales. Results stay under embargo until the minute of publication: markets all learn them at the same time.
Why do these numbers move prices? Because they feed the Federal Reserve’s decisions. The law gives it a dual mandate: price stability and full employment. Releases therefore fall into two families, inflation (CPI, PPI, PCE) and employment (NFP, jobless claims). A number that changes the market’s idea of the FOMC’s next decision moves Treasury yields, the dollar, and, in turn, indices, gold, and crypto. That is the whole mechanism of the cost of money: when the expected policy rate changes, every asset adjusts.
This guide focuses on US numbers: the dollar is the reference currency of global markets, and a surprise in Washington moves EUR/USD, the S&P 500, gold, and Bitcoin all at once. The euro area has its own releases, which you will find further down in the calendar.
CPI, PPI, PCE, NFP: What Each Number Measures
Four acronyms come up constantly in the economic calendar. Three measure inflation, at different levels of the economy; the fourth measures employment. Knowing them means knowing in one second what a number can change.
The CPI, the Consumer Price Index
The CPI (Consumer Price Index) measures the average change in the prices consumers pay for a representative basket of goods and services: food, energy, housing, transportation, health care, recreation. The BLS publishes it every month at 8:30 a.m. New York time; in 2026, it comes out between the 10th and the 14th of the following month. The version quoted everywhere, the CPI-U, covers more than 90% of the US population.
Two readings coexist. Headline CPI takes in the whole basket; core CPI, which gauges underlying inflation, removes food and energy, two categories that swing with oil prices and harvests. Each is reported over one month, seasonally adjusted, and over one year. Traders first watch the monthly change in core: it is what tells you whether inflation is taking hold, whereas the headline number can be just an oil-driven spike.
| September 2026 CPI (released October 14) | Month over month | Year over year |
|---|---|---|
| Headline (whole basket) | +0.6% | +3.7% |
| Core (excluding food and energy) | +0.3% | +2.6% |
| Energy | +5.2% | +20.4% |
| of which gasoline | +9.1% | +34.2% |
| Food | 0.0% | +2.5% |
| Shelter (housing) | +0.4% | +3.2% |
Source: BLS, October 14, 2026 release. Month-over-month changes are seasonally adjusted; year-over-year changes are not.
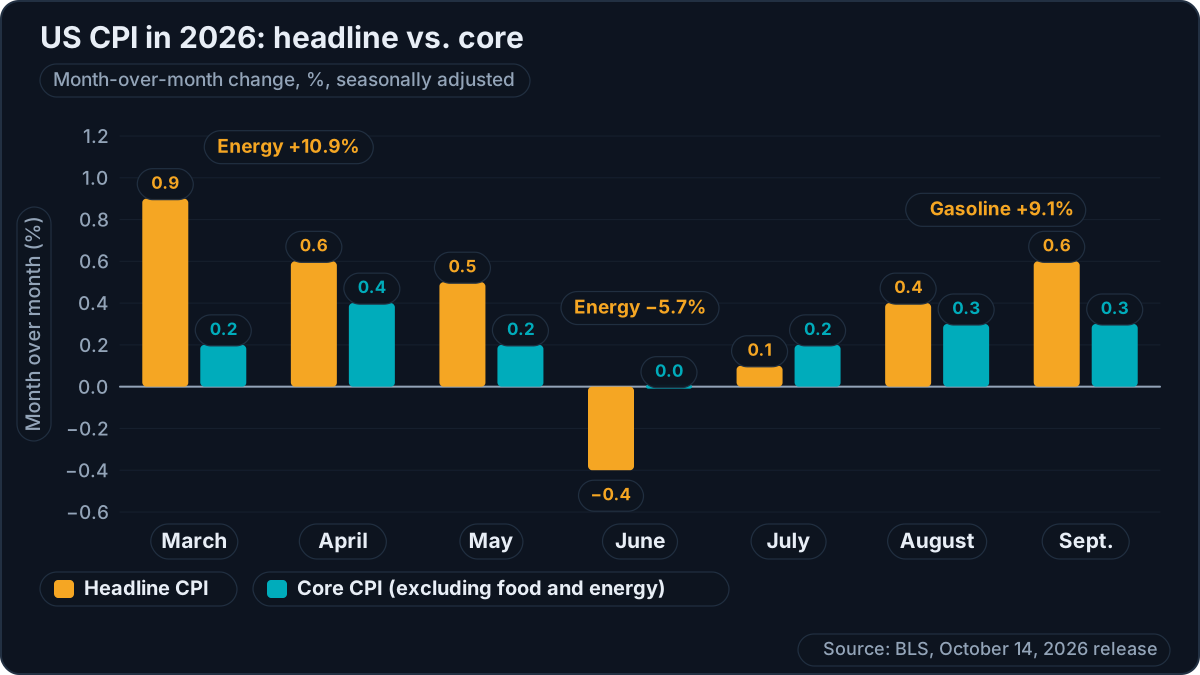
Headline CPI follows the swings in energy, while core reveals the underlying trend in inflation: the last seven months, based on BLS data.
The chart tells the story of seven months of 2026. In March, energy jumps 10.9% in the month and headline CPI 0.9%; in June, energy falls 5.7% and headline drops to −0.4%. Meanwhile, core stays between 0.0% and 0.4% a month. A trader who reads only the headline number gets pushed around by the price of gasoline; one who reads core sees what the Fed is trying to measure.
The PPI, the Producer Price Index
The PPI (Producer Price Index) approaches the problem from the other end: it measures the average change in the selling prices US producers receive, from the seller’s point of view rather than the buyer’s. The benchmark figure is the “final demand” index, which covers goods, services, and construction. It also comes out every month at 8:30 a.m., published by the BLS, often the day before or the day after the CPI.
Why follow it? Because a rise in producer prices often ends up, at least in part, in the prices consumers pay — with a lag, and not automatically, since companies can absorb some of it. In August 2026, the final demand PPI rose 0.4% over the month and 5.4% over the year, while the CPI for the same month showed +3.4%: pressure in the pipeline. The PPI is also used to anticipate the PCE, as we will see.
The PCE, the Index the Fed Targets
The PCE (Personal Consumption Expenditures price index) is published every month by the BEA, in its report on household income and spending, two to three weeks after the CPI. It resembles the CPI, but it doesn’t cover exactly the same spending and doesn’t weight it the same way: the two measures can diverge sharply. In August 2026, core PCE rose 3.0% over the year, versus 2.4% for core CPI.
Yet it is the one that matters most to the Fed: its 2% target is defined on the PCE index. Kevin Warsh repeated it at Jackson Hole on August 28, 2026: the 2% objective, “as measured by the personal consumption expenditures (PCE) price index,” is a “firm, fixed target.” On the market side, the PCE usually surprises less than the CPI, because the CPI and PPI for the same month already make it possible to estimate it. On September 16, Warsh did so himself at the press conference: “based on the most recent CPI and PPI data,” the 12-month change in PCE prices “likely was around 3.6 percent” in August. The official figure, published on September 30, came in at 3.4%: a close estimate, not an exact one — and that gap is precisely what the market has to digest.
The NFP, the Monthly Jobs Report
The NFP (Non-Farm Payrolls) is the nickname for the BLS’s monthly employment report, the Employment Situation. It often comes out on the first Friday of the month, at 8:30 a.m. New York time, and delivers three numbers that the market reads within the same minute: nonfarm job creation (a survey of businesses), the unemployment rate (a survey of households), and average hourly earnings, which link the report to inflation.
The September 2026 report, published on October 2, shows why you need to read the whole line: +29,000 jobs and unemployment at 4.2%, but July and August revised down by a combined 60,000 jobs. The month’s number matters, and so does the revision of the previous two. In 2026, though, employment takes a back seat: on September 16, Kevin Warsh judged the employment side of the Fed’s mandate to be “in good shape” and said he was focusing his attention on price stability.
The Other Releases on the Calendar
Around these four pillars revolve other releases, less decisive one by one, but which complete the picture. The Paris times below hold for most of the year; for US numbers, subtract an hour during the weeks when the clock changes are out of sync.
| Release | Published by | Frequency | Paris time |
|---|---|---|---|
| Weekly jobless claims | Department of Labor | Every Thursday | 2:30 p.m. |
| Retail sales | Census Bureau | Monthly, around mid-month | 2:30 p.m. |
| GDP | BEA | Quarterly, in three estimates | 2:30 p.m. |
| Job openings (JOLTS) | BLS | Monthly | 4:00 p.m. |
| ISM indexes (manufacturing, services) | Institute for Supply Management | Monthly, at the start of the month | 4:00 p.m. |
| FOMC decision | Federal Reserve | Eight meetings a year | 8:00 p.m. |
| ECB decision | European Central Bank | About every six weeks | 2:15 p.m. (press conference at 2:45 p.m.) |
On the European side, euro-area inflation (the HICP) gets a flash estimate from Eurostat at the end of each month, and the ECB meets on October 28–29 and then December 16–17, 2026. These numbers mostly move the euro; US numbers, for their part, move everyone.
Reading a Number in 30 Seconds: Actual, Forecast, Previous
On any economic calendar, a release fits on one line and three columns. Actual: the number that has just come out. Forecast: the consensus forecast, meaning what economists and the market expected. Previous: the figure from the month before, sometimes revised along the way.
It all comes down to one idea: the market has already priced in the forecast. What moves prices is the surprise, the gap between Actual and Forecast. A core CPI of +0.3% tells you nothing on its own: if the consensus expected +0.2%, it is a bad surprise on inflation, and if it expected +0.4%, it is good news.
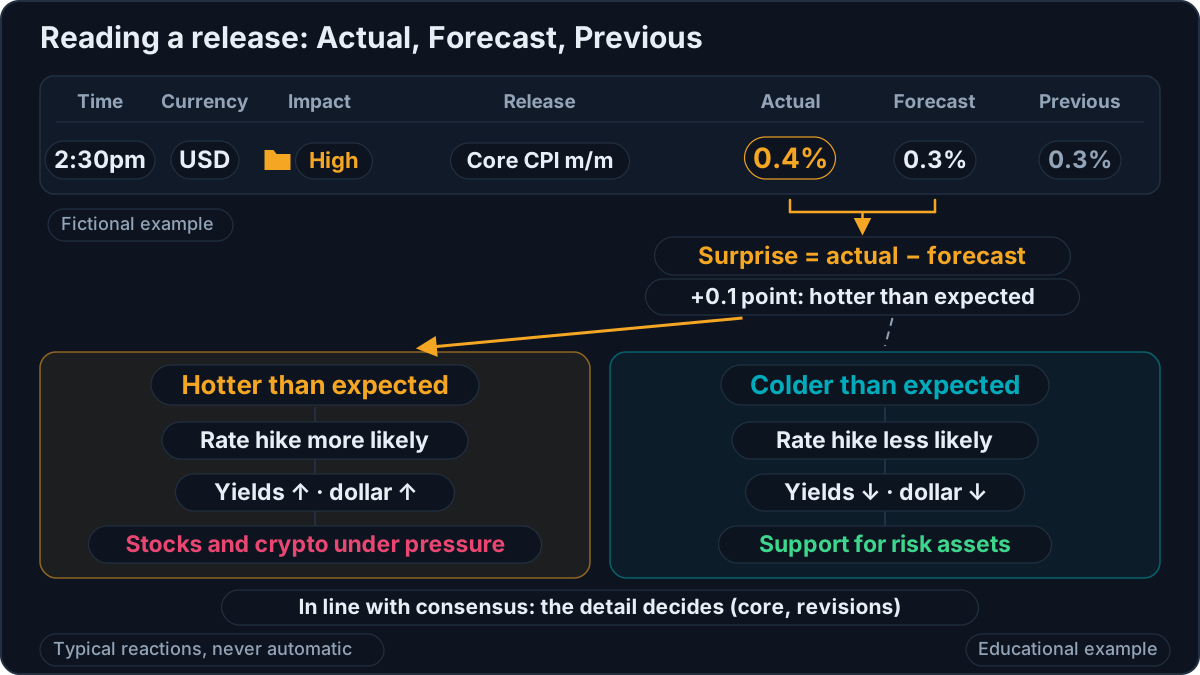
Anatomy of a release, using a fictional example: it is the gap from the consensus that moves the market, and the reaction is anything but automatic.
Four reflexes make the difference when the number drops:
- Core before headline. The headline number can be driven by gasoline; core tells you whether inflation is spreading.
- The month before the year. The year-over-year change drags along twelve months of history and depends on the figure from a year ago, the base effect; the monthly change shows what is happening right now.
- Revisions. A revised “Previous” can change how you read the month, especially for employment.
- The detail after the first second. Algorithms react to the main figure within milliseconds; humans then read the detail, and the move can reverse. The first candle doesn’t make the day.
| What comes out | How the market reads it | Typical reaction (nothing automatic) |
|---|---|---|
| Inflation higher than expected | A tighter Fed (hawkish) | Yields and the dollar up, pressure on stocks and crypto |
| Inflation lower than expected | A Fed in less of a hurry (dovish) | Yields and the dollar down, support for risk assets |
| Employment stronger than expected | The Fed can keep rates high | Leaning bullish for yields and the dollar |
| Employment weaker than expected | Fear of a slowdown, lower expected rates | Yields down, stock reaction more uncertain |
| A number in line with the consensus | Nothing new | Muted move: the detail (core, revisions) decides |
These reactions remain tendencies. The most directly affected are the dollar and Treasury yields (our article on the US bond market explains why the 10-year yield weighs on everything else), then indices like the S&P 500 and, often in their wake, crypto, depending on the correlation detailed in our S&P 500 and crypto analysis. To follow these reactions live, the Data & Markets page shows the US 10-year yield, the dollar index (DXY), gold, and the indices.
Why Markets React More Strongly Since Kevin Warsh
The Fed No Longer Announces Its Next Moves
Since December 2008 and the chairmanship of Ben Bernanke, the Fed practiced forward guidance: it indicated in advance the likely direction of its rates, to guide expectations. Under Jerome Powell, the April 29, 2026 statement still specified that, in deciding the extent and timing of its next adjustments, the committee “will carefully assess incoming data.” The market knew what to watch, and the Fed told it how to interpret it.
Kevin Warsh broke with this practice. From his very first meeting, on June 17, 2026, the statement became less than half as long, and that sentence disappeared. At Jackson Hole on August 28, he previewed his speech by saying you could call it an outline or a trail map, “just don’t call it forward guidance” — a practice that, in his view, “has overstayed its welcome.” On September 16, at the press conference, he drove the point home: “I’m not in the forward guidance business.” It is the “regime change” he announced as early as his Senate hearing in April.
“Trends Matter”: What Warsh Really Looks At
Beware of a misreading: Warsh doesn’t claim to scrutinize every number. Quite the opposite. “I’m not a data-point-dependent guy,” he said on September 16, before observing that, over the past decade or so, markets have “grown accustomed to waiting somewhat breathlessly on a data point.” His rule fits in three sentences: “Trends matter. Data points are noisy. Data point dependence is a dangerous preoccupation.”
What he looks at, he spelled out at Jackson Hole. His standard: “We must be confident that underlying inflation is moving to our objective, clearly and at sufficient speed. Otherwise, we have work to do.” To judge it, he compares the rise in PCE prices over twelve months (3.7% at the time) and over the last six months (4.1%), to see whether the recent pace is accelerating or slowing. He tracks the core measures of PCE and CPI, and he counts the share of the 199 components of the PCE basket whose prices are rising by more than 3%: 54% over twelve months, versus 32% in the two decades before the pandemic. Not to mention commodity prices.
The direct consequence: a single good number isn’t enough to change the Fed’s mind. Warsh said so at Jackson Hole: this summer’s PCE and CPI readings were “better than expected,” but they did “not tell me that underlying trends have meaningfully improved.” Less than three weeks later, the FOMC raised its rate by a quarter point, to 3.75%–4.00%, unanimously. For a trader, the lesson is clear: read core and the trend over several months, not just the number of the day.
The Paradox: Less Guidance, More Reactions
If Warsh distrusts single numbers, why do markets react to them more? Because without forward guidance, the market is left with only one compass: the data itself. The trajectory the Fed is watching is built number after number, and nobody comes along anymore to say in advance whether it is “passing the test.” Every CPI, every PPI, every PCE adds a point to the six- and twelve-month curve and changes the probability of the next hike. The market does alone the work that the statement used to do for it, and it does it within the minute of publication.
The official transcript of the September 16 press conference keeps a record of it: one reporter recalled that there had been “a ton of focus on the August CPI” ahead of the meeting, and a colleague that “the market priced in a 90 percent chance of a rate hike.” In 2022, when US inflation peaked at 9.1% over the year, a level not seen since 1981, every CPI was already an event. With Warsh, the numbers once again become the best clue to the next decision: that is why it is interesting to watch for them again.
A Month of Numbers Before the Fed: The October Example
Releases don’t land at random: they follow an order that repeats every month and leads up to the Fed’s decision. October 2026 is a perfect example. Employment kicks things off on Friday, October 2, CPI follows on Wednesday, October 14, and PPI and retail sales on Thursday, October 15. The committee decides on the evening of Wednesday, October 28, with September’s CPI and PPI in hand — enough to estimate the PCE, which will only be published the next day, Thursday, October 29, along with the first estimate of third-quarter GDP. That same Thursday, the ECB announces its own decision at 2:15 p.m.
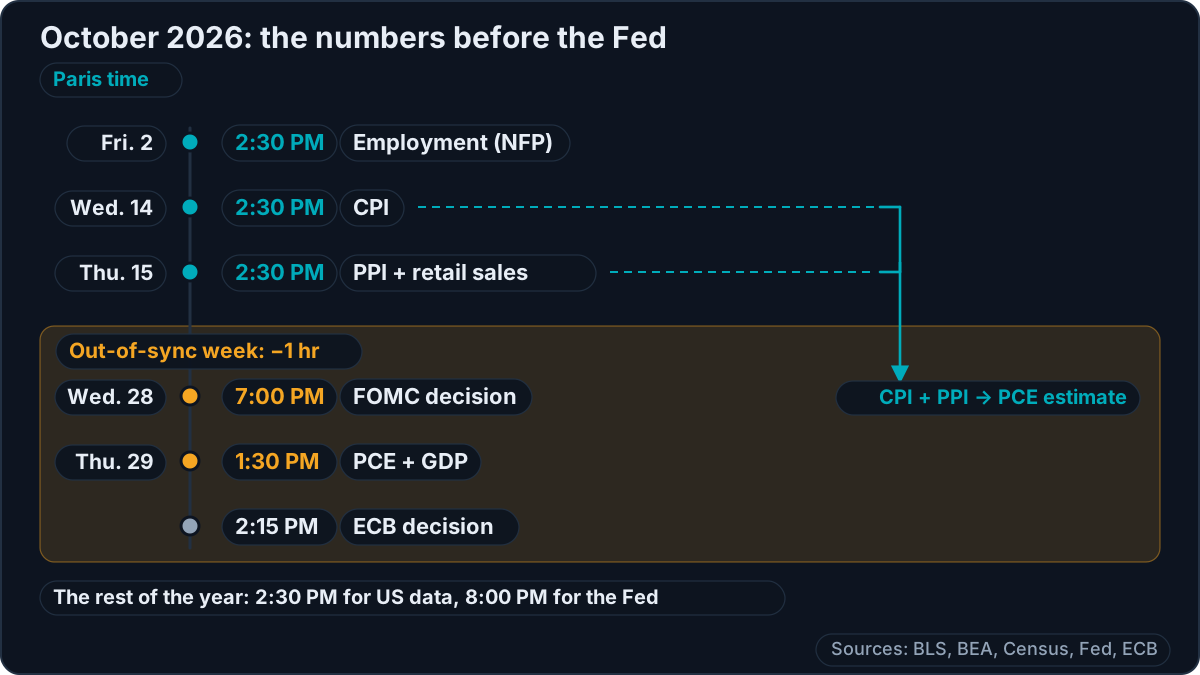
October 2026 in Paris time: CPI and PPI land before the Fed, PCE right after. During the out-of-sync week, US releases arrive an hour earlier.
Note the two unusual times at the end of the month. France goes back to winter time on Sunday, October 25, the United States only on Sunday, November 1: during that week, 8:30 a.m. in New York corresponds to 1:30 p.m. in Paris, and the Fed’s decision comes out at 7:00 p.m. instead of 8:00 p.m. The same gap returns in spring: in 2027, from March 14 to 28. The trading session times follow the same logic, hence the value of a calendar set to your own time zone.
The Next Releases, in Paris Time
Here are the main releases through the end of 2026, taken on October 14 from the official calendars of the BLS, the BEA, the Census Bureau, the Fed, and the ECB. The Paris times are calculated from the official Washington time and the clock-change rules of the two continents.
| Date | Paris time | Release |
|---|---|---|
| Thursday, October 15 | 2:30 p.m. | September PPI and retail sales |
| Wednesday, October 28 | 7:00 p.m. | FOMC decision (out-of-sync week) |
| Thursday, October 29 | 1:30 p.m. | September PCE and third-quarter GDP (out-of-sync week); ECB decision at 2:15 p.m. |
| Friday, November 6 | 2:30 p.m. | October employment (NFP) |
| Tuesday, November 10 | 2:30 p.m. | October CPI |
| Friday, November 13 | 2:30 p.m. | October PPI |
| Tuesday, November 17 | 2:30 p.m. | October retail sales |
| Wednesday, November 25 | 2:30 p.m. | October PCE and GDP (second estimate) |
| Friday, December 4 | 2:30 p.m. | November employment (NFP) |
| Wednesday, December 9 | 8:00 p.m. | FOMC decision and dot plot |
| Thursday, December 10 | 2:30 p.m. | November CPI |
| Tuesday, December 15 | 2:30 p.m. | November PPI |
| Wednesday, December 16 | 2:30 p.m. | November retail sales |
| Thursday, December 17 | 2:15 p.m. | ECB decision (press conference at 2:45 p.m.) |
| Wednesday, December 23 | 2:30 p.m. | November PCE and GDP (third estimate) |
These dates can move: after the US federal government shutdown in the fall of 2025, several releases in early 2026 were postponed. The right reflex: check the day before on your economic calendar, and keep the Fed’s official calendar handy for decision evenings.
Watching the Numbers on Forex Factory (and Elsewhere)
The Forex Factory calendar remains the most practical free tool for following these releases. Our Forex Factory guide shows, with screenshots, how to set it up; here are the essentials, applied to CPI and PPI.
- Set the time zone to Paris, or to your own. The calendar’s times then follow the clock changes on their own: no more mental math during the out-of-sync weeks.
- Filter for high impact. Each event carries a folder icon: red for high impact, orange for medium, yellow for low. BBS, our traditional-markets specialist, keeps only the red: CPI, PPI, NFP, rate decisions, and a few others. Tick the USD currency, and the EUR if you trade EUR/USD.
- Read the line at the moment of publication. The Actual, Forecast, and Previous columns give the number released, the consensus forecast, and the prior figure. The actual value is displayed in green or red depending on whether it is judged better or worse than forecast… for the currency.
- Open the event details. They list the official source, what the number measures, its usual effect on the currency, and the date of the next release.
The color-coding trap deserves a closer look. For Forex Factory, a CPI higher than forecast is “good for the currency”: it is displayed in green, because stronger inflation makes a rate hike more likely, which supports the dollar. For stocks and crypto, that same green number is often bad news. Forex Factory’s green is read from the currency’s point of view, never from your portfolio’s.
Other calendars do the same job. The one from TradingView sits next to your charts, and the official TradingView MCP server, reserved for paid plans, even lets you ask your AI for the week’s high-impact releases. For crypto-specific events, such as network upgrades or listings, CoinMarketCal completes the picture. And before the week starts, a glance at the COT reports tells you how large speculators are positioned on currencies, gold, or rates ahead of the numbers.
Trading a Release Without Getting Trapped
A high-impact release concentrates in a few seconds a volatility that the market sometimes takes hours to produce. It is an opportunity for those who are prepared, and a trap for those who discover the event at 2:29 p.m. The house rule, restated in the Forex Factory guide, doesn’t change: we avoid entering just before a major release, and we reduce our exposure if we are already in a position.
Before: Decide with a Cool Head
Identify the week’s releases as early as Sunday, note them in your plan, and write your scenarios in advance: “If core comes out above the consensus, I…” If you keep a position, reduce its size — the position size calculator does it in a few seconds, and Trade Assistant automates it on MetaTrader — and place your stop before the release, never during. If you trade for a prop firm, reread its rules: many forbid opening a position a few minutes before and after a high-impact release, as our prop firm guide details.
During: The Minute Everything Goes Haywire
In the seconds after the release, liquidity pulls out of the order book. The spread widens, slippage lurks, and a stop can be executed much farther away than planned. The first wicks often shoot in both directions, sweeping the stops on both sides before a direction takes hold. In crypto, leverage adds a layer: a wick of just a few percent is enough to trigger chain liquidations. Check your threshold with the liquidation price calculator before the release.
After: Let the Dust Settle
The safest reflex is often patience: wait for the first 5- or 15-minute candle to close, let the market digest the detail of the number, then look for an entry at a clear level, a support, a resistance, or a swept liquidity zone. The Forex Factory guide reminds us: news trading is much harder in the crypto market, where liquidity is thinner. Finally, record each release and your reaction in your trading journal: after a few months, you will know which numbers move your markets.
Frequently Asked Questions
What is the CPI in the stock market?
The CPI, or Consumer Price Index, is the US index of consumer prices. Published every month by the Bureau of Labor Statistics, it measures the change in prices for a representative basket of goods and services. Markets watch it because it steers the Fed’s rate decisions: a CPI higher than expected leads markets to anticipate higher rates, which generally supports the dollar and weighs on stocks and crypto.
What is the difference between CPI and PPI?
The CPI measures the prices consumers pay, the PPI the selling prices producers receive. The PPI therefore looks at inflation upstream: a rise in producer prices can later pass through to consumers, though not automatically, because companies can absorb part of it. Both are published every month by the Bureau of Labor Statistics, often a day apart, at 2:30 p.m. Paris time.
What time does the US CPI come out in France?
The CPI is published at 8:30 a.m. New York time, which is 2:30 p.m. in Paris most of the year. It comes out at 1:30 p.m. when one of the two countries has already changed its clocks and the other hasn’t yet: from the second Sunday of March to the last one, then from the last Sunday of October to the first Sunday of November. The October 2026 CPI comes out on Tuesday, November 10, at 2:30 p.m.
Why does the Fed look at PCE rather than CPI?
Because its 2% inflation target is officially defined on the PCE price index, published by the Bureau of Economic Analysis. The PCE covers a broader range of spending than the CPI and weights categories differently, so the two measures can diverge. Since it comes out two to three weeks after the CPI and PPI, economists estimate it in advance from those two indexes.
What is the NFP in trading?
The NFP, short for Non-Farm Payrolls, refers to the US monthly employment report from the Bureau of Labor Statistics, often published on the first Friday of the month at 2:30 p.m. Paris time. It gives the number of nonfarm jobs created, the unemployment rate, and the change in average hourly earnings. The revisions to the previous two months matter as much as the month’s number: in September 2026, they took 60,000 jobs away from July and August combined.
Is a higher-than-expected CPI bad for Bitcoin?
Often, but not always. Inflation stronger than the consensus leads markets to anticipate higher rates, which generally pushes yields and the dollar up and weighs on risk assets, crypto included. But the reaction depends on the detail of the number (core, revisions), on what the market had already priced in, and on the context of the moment. The first candle can reverse within minutes: better to wait for it to close.
Why have markets reacted more to the numbers since Kevin Warsh?
Since taking the helm of the Fed on May 22, 2026, Kevin Warsh has abandoned forward guidance: the Fed no longer indicates the direction of its rates in advance. Warsh says he judges by trends rather than by a single number, but without guidance, the market has to reconstruct those trends itself from each release. Every CPI, PPI, or PCE therefore changes the probability of the next decision, and prices move within the minute that follows.
When is the next US CPI released?
The October 2026 CPI will be published on Tuesday, November 10, 2026, at 2:30 p.m. Paris time, and November’s on Thursday, December 10, at the same time. The PPI follows on Friday, November 13, and Tuesday, December 15. The official dates are listed on the Bureau of Labor Statistics calendar, and most economic calendars, such as Forex Factory, display them in your time zone.
Going Further
Economic releases predict nothing on their own: they say where the economy stands, and the market infers from them what the Fed will do. Under Kevin Warsh, that reasoning is back at the heart of trading, because the Fed has stopped doing it in the market’s place. Read core before headline, the trajectory before the number of the day, and decide your size before 2:30 p.m.: that is the whole spirit of our risk management approach — decide before, not during.
To round things out, the complete FOMC guide explains who votes and how a decision is made, the dot plot guide teaches you to read the December 9 projections, and the history of the Fed’s chairs places the Warsh era within a century of monetary policy. And for the next release, see you on your economic calendar, set to Paris time.
Every guide here is free. Browse the full course and join a community of traders who share ideas every day.