You see these rectangles everywhere on your charts: imbalance, FVG, fair value gap, single print. Four words for the same market event — a zone where price only moved in one direction, very fast, leaving almost no volume behind it.
One thing to clear up right away, because it shapes this whole guide: we don't do Smart Money Concepts. The Cap says it himself in the first video below — "I don't like saying FVG, because I don't do SMC." We read these zones through order flow and market profile, not ICT vocabulary. What shows up on the chart is often the same thing — the reasoning behind it is different.
Key takeaways:
- An imbalance is a zone of aggression: price moved through it fast, in one direction only, on very little volume traded.
- The ICT pattern is precise: three candles, with the wicks of candle 1 and candle 3 not overlapping. Bullish version: the BISI; bearish version: the SIBI.
- In order flow, it's called a single print, or a "thin leg": open up the candle and you'll find almost nothing but orders on one side.
- It's because there's so little volume that the zone fills back in fast when price returns — just like a gap. Not magic, just mechanics.
- Main use on our end: a target (for taking profit) or a zone to watch for a reversal — not an automatic entry signal.
- Close through the zone and it flips (IFVG): the old support becomes resistance. And the midpoint of the gap — the CE, at 50% — is the most closely watched reaction level.
- Price is never obligated to come back for it: "if we come back for that zone — because that's not a given."
Imbalance, FVG, Single Print: What Are We Talking About?
The word imbalance literally means just that — an imbalance between two sides. On a healthy market, buyers and sellers exchange contracts at every price level: price rises or falls by "paying" its way through. In an imbalance, that exchange never happened: one side took control, price jumped several levels at once, and what's left is a zone where almost nothing was traded.
The three words you'll run into all describe the same thing, seen through three different schools.
| Term | School | What It Means |
|---|---|---|
| Imbalance | Order flow / generic | A low-volume aggression zone, whatever its size |
| FVG (Fair Value Gap) | SMC / ICT | The same zone, formalized as a precise three-candle pattern |
| Single print | Market profile | A price level touched only once — the trace of that same aggression |
It's the same market event, just named differently depending on the tool you're looking through. Which is exactly why "imbalance or FVG?" is the wrong question — the real one is how you measure it and what you do with it.
The Exact Pattern: Three Candles, One Simple Rule
The name may come from Smart Money, but the pattern itself checks out in three seconds. A bullish Fair Value Gap forms when the low of candle 3 stays above the high of candle 1: between the two wicks, a whole price range was never traded. Candle 2 — the displacement candle — is the one that did all the work; its impulse is what creates the gap.
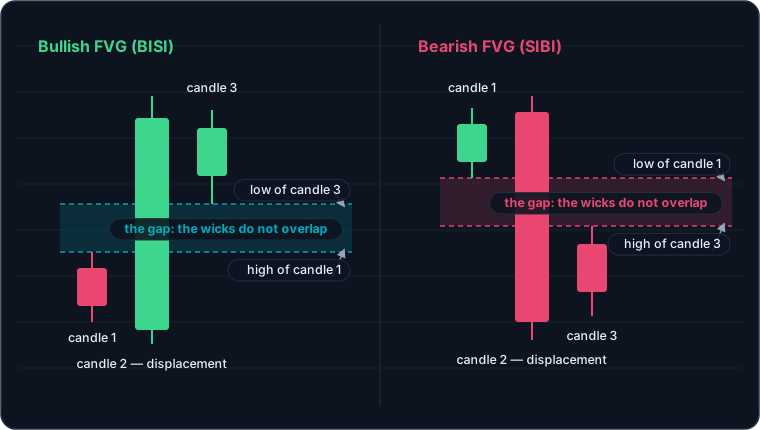
The pattern in both directions: the zone is drawn wick to wick, between candle 1 and candle 3.
The bearish FVG is the exact mirror: the high of candle 3 stays below the low of candle 1. In both cases, the zone is drawn wick to wick — what counts is the space price actually jumped over, not what the candle bodies suggest.
Three details that prevent most drawing mistakes:
- An FVG belongs to its timeframe. The gap you see on the M15 might not exist on the H1, where those three candles merge into one. Before drawing any conclusion from it, spell out which chart it lives on.
- No displacement, no FVG worth your attention. Three sluggish candles leaving a micro-gap inside a range is consolidation noise, not aggression.
- The zone stays valid until it's filled. It projects forward in time — price can come back for it hours or weeks later.
BISI, SIBI, CE, IFVG: The ICT Vocabulary Decoder
You'll run into these acronyms in every SMC video out there. We don't build our method on them, but understanding them makes you self-sufficient — and you'll see they describe things order flow already explains just fine.
| Acronym | Full Name | What It Means |
|---|---|---|
| BISI | Buyside Imbalance, Sellside Inefficiency | The bullish FVG: only buyers got served — a zone expected to act as support |
| SIBI | Sellside Imbalance, Buyside Inefficiency | The bearish FVG: the exact mirror — a zone expected to act as resistance |
| CE | Consequent Encroachment | The midpoint of the gap (50%): the most closely watched reaction level in the zone |
| IFVG | Inversion Fair Value Gap | An FVG closed through changes polarity: the old support becomes resistance, and vice versa |
| BPR | Balanced Price Range | A bullish and a bearish FVG that overlap: a doubly inefficient zone, reactions often sharp and clean |
The Consequent Encroachment deserves a bit more explanation, because it changes how you aim: plenty of traders don't wait for a zone to fill completely. If price touches the exact midpoint of the gap and reacts, the zone has often "done its job" without being fully rebalanced. That's a partial target at mid-zone — and a warning sign if price pushes through it without any reaction.
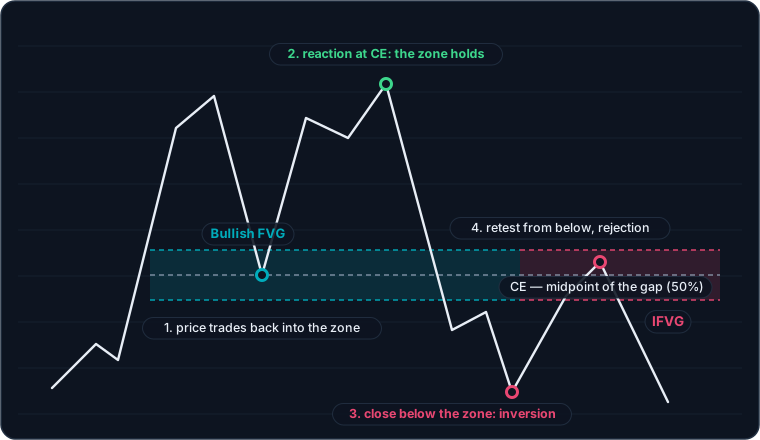
The life of an FVG: it comes back into the zone, reacts at the CE… and if price closes through it, the zone flips — that's the IFVG.
The IFVG is the most useful part of the lot. A broken FVG isn't "dead" — it just switches sides. And in order-flow terms, there's nothing mystical about it: a low-volume zone plowed through with conviction becomes the trapped position of whoever was on the other side — which is exactly the wall that gets defended on the retest.
Why These Zones Work
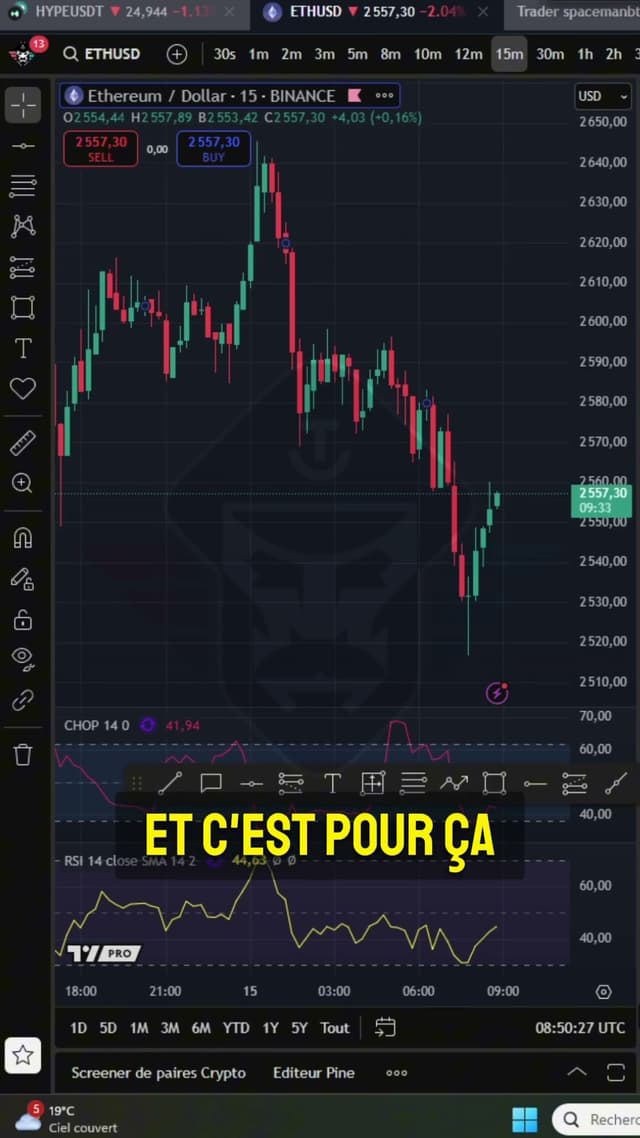
Imbalance & FVG: why these zones work — the Cap opens up the candle in order flow.
The reason fits in one sentence: these are low-volume zones. When price comes back to one, there's almost no one left to stop it — so it moves through fast, exactly the way it fills a gap. It's not prophecy, it's plumbing.
To really see it, you have to "step inside the candle." That's exactly what order flow lets you do: instead of one red candle, you see exactly what traded at every level. In a bearish imbalance, it's obvious — almost nothing but sell orders, and an excessively fast drop. The size of each line shows you the real volume: that's where the "feverish zone" shows itself.
That reading changes everything compared to a rectangle mechanically drawn over three candles: you're no longer spotting a shape, you're spotting an absence of participation. And an absence of participation can be checked.
Spotting Them: Following the Single Print
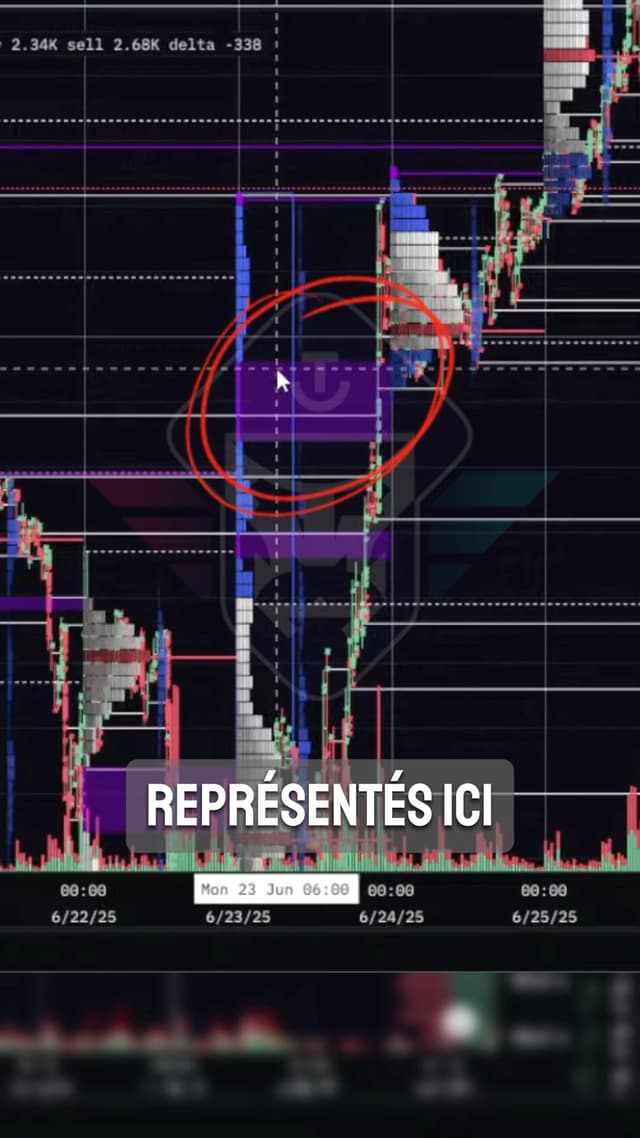
The secret behind imbalances: single print zones, and how to break them down.
In market profile, the same zone has an even more telling name: the single print. It's a price level the market only touched once — a "thin leg," where almost no price action happened at all. The link to a gap is direct: little volume inside it, so little resistance on the way back.
Concretely, in the video's example: one single print between 105,000 and 104,200, then a second one between 103,500 and 103,300. Two separate zones, split by a zone that traded normally.
And here's the method detail worth the detour: in his analysis, the Cap often lumps both into one big rectangle — easier to communicate. But he says it straight, "the reality is we could refine the zone and split the two single prints more precisely." If you want a surgical target instead of a wide zone, that's exactly the work to do: split it instead of lumping it.

 DEXon-chain
- 5% cashback on your trading fees with our link
- Trouble on the platform? Go through the Cap: our team never leaves you hanging.
- Fully on-chain perpetuals
- Wallet-based access
- On-chain order book
- Community-owned, no VCs
Affiliate link · trading involves risk of loss
Valid FVG or Just Noise: Context Is Everything
The real problem with this concept isn't the concept itself — it's seeing it everywhere. Four filters separate the zones worth your attention from background noise:
- Displacement comes first. A real zone is born from an impulse candle — wide and decisive. Open that candle up in order flow and you'll confirm there really was one-sided aggression — not just a gap between two timid candles.
- What comes before it matters as much as the pattern. The most interesting zones form right after a liquidity grab — stops swept below an obvious low, followed by an impulsive reversal. The aggression has a cause, and that cause can be read.
- The higher timeframe calls the shots. An FVG on the H4 structurally carries more weight than one on the M5. The clean method: spot zones on the H4/H1, execute on the M15/M5 — never the other way around.
- The time it formed. An impulse born during the kill zones — the London or New York open — doesn't carry the same weight as a random 3 a.m. spike on no volume.
If you want the full SMC framework around these filters — structure, premium/discount, entry models — the Smart Money Concepts guide lays it out properly. Here, we're sticking with a volume-based reading: it's enough to make the call.
How to Actually Use Them
Three uses, in decreasing order of reliability:
- As a take-profit target. This is the most solid use: if an imbalance sits above your entry, it's a credible objective — price has good reason to go fill it. Write it into your trading plan before you enter, not after.
- As a possible reversal zone. Once the zone is filled, the market has "done its job" and may correct: that's where a short (or a long) becomes worth considering. Worth considering: not automatic.
- As contextual information. A string of imbalances in the same direction tells the story of continuous aggression — useful for reading the strength of a move, independent of any entry.
What an imbalance is not: an entry signal on its own. Like everything else in our method, it only counts once confirmed by context — key levels prepared in advance, structure, and defined risk management.
A word on entries inside the zone, since that's how SMC actually uses it. The aggressive model enters as price returns into the gap, often right at the CE at 50%, with the stop placed on the other side of the zone. The conservative model waits for a lower-timeframe confirmation — a structure shift inside the zone — before committing. Either way, the logical target is the opposite liquidity: the obvious high or low on the other side. This isn't our preferred entry — we use the zone as a target first. But if you do trade it, trade it like this: stop defined by the zone, never by feel.
Common Mistakes
- Assuming every imbalance gets filled. The Cap is explicit: "if we come back for that zone — because that's not a given." In a strong trend, zones can stay open for a very long time — sometimes for good.
- Mixing up an imbalance with a price gap. A gap comes from a break in trading (weekend, overnight); an imbalance forms during continuous trading, in the middle of a session.
- Lumping everything into one big rectangle. Handy for communicating, sloppy for trading. Two separate single prints deserve two zones.
- Trading the zone without looking inside it. Without order flow, you're assuming there's little volume. With it, you can see it.
- Stacking the synonyms. Imbalance, FVG, inefficiency and single print aren't four signals confirming each other: it's one signal, seen through four tools.
- Confusing it with footprint "imbalance." In order flow, the same word describes an aggressive bid/ask imbalance inside a single candle — a book-reading tool, unrelated to the SMC wick gap. Two schools, one word: always be clear which one you mean.
- Marking every micro-gap inside a consolidation. Without displacement, an FVG is just a space between two sluggish candles — a range churns out dozens of them and fills every single one.
- Reading the zone outside its timeframe. An M5 FVG doesn't "hold" on an H4 chart. Label the timeframe on every zone you draw.
Frequently Asked Questions
Are Imbalance and FVG the Same Thing?
In practice, yes: both describe a zone where price only moved one way, on low volume. The difference is vocabulary and measurement method. "FVG" comes from Smart Money (a three-candle pattern, boundaries drawn on the wicks); "imbalance" is the generic order-flow term, which cares about volume actually traded rather than the shape of the candles.
Does Every Imbalance Get Filled?
No, and that's the most common mistake. The tendency to fill back in is explained by the zone's low volume, not by some rule of the market. In a strong trend, many are never revisited. Treat them as probable targets, never as guaranteed appointments.
What Tools Should You Use to Spot Them?
With the naked eye on a chart, you'll spot the big ones. To read what's inside — to know whether volume was really that low, and which side the orders were on — you need order flow (footprint) or a market profile for the single prints. That's the difference between assuming and checking.
Do You Need to Trade SMC to Use Imbalances?
No. That's actually the whole point of this guide: the zone exists independently of whatever vocabulary gets applied to it. SMC gives it a name and a pattern; order flow explains why it works. You can absolutely trade one without buying into the other.
What Is an IFVG (Inversion Fair Value Gap)?
An FVG that price has closed through to the other side. The zone isn't invalidated — it changes polarity. A broken bullish gap becomes resistance; a broken bearish gap becomes support. The retest of the flipped zone is one of the most closely watched triggers in SMC — and in order-flow terms, it's simple: whoever was defending the zone has switched sides.
What Is the Consequent Encroachment (CE) For?
It's the exact midpoint of the gap, at 50%. A rebalance doesn't need to be complete: if price touches the CE and reacts, the zone has often "done its job." Practical use: a partial target at mid-zone, and a red flag if price pushes past it without any reaction at all.
Are FVG and Liquidity Void the Same Thing?
Same family, different scale. The FVG is the measurable unit: three candles, clean boundaries. A liquidity void is the extended version — a low-volume corridor spanning several candles, which price usually retraces through at high speed. A void, in fact, often contains several FVGs nested inside it.
Which Timeframe Should You Look for FVGs On?
Whichever one you make your decisions on, plus one above it. In practice: the zones that matter get spotted on the H4/H1, execution gets handled on the M15/M5. And remember, an FVG belongs to its timeframe: the one you see on the M15 doesn't necessarily exist on the H1.
Taking It Further
An imbalance isn't a box-ticking pattern: it's the visible trace of a moment when the market ran short of a counterparty. Seen that way, it joins the rest of order-flow reading — order flow, market profile, CVD — and stops being a chart gadget.
The logical next step: learn to read the volume inside candles, log your zones in your journal, and check across fifty observations how many actually fill in your markets. That's the only number that matters: your own.
Every guide here is free. Browse the full course and join a community of traders who share ideas every day.