The ADX — Average Directional Index — answers just one question, but it’s the most important one of all: is there a trend worth trading, yes or no? Not its direction, not its target — its strength. Linda Raschke and Larry Connors describe it as “one of the most powerful and most misunderstood indicators” — and both halves of that description are true.
At Captain Trading, it’s not a decorative indicator: it serves as over-confirmation in our screening method and even shapes the distance of our trailing stops — you’ll see both uses further down, numbers included. But let’s start at the beginning, because half the mistakes made with the ADX come from a single confusion: mistaking a strength gauge for a compass.
The essentials:
- The ADX measures trend strength, from 0 to 100 — never its direction. It rises just as much in a violent sell-off as in a powerful rally.
- It’s part of Welles Wilder’s DMI system (1978): three lines — +DI (buying pressure), −DI (selling pressure), and the ADX, which synthesizes the gap between them.
- Standard reading: below 20, no trend; 20-25, gray zone; above 25, tradable trend; beyond 40, strong trend.
- The slope matters more than the level: an ADX at 28 and rising says more than an ADX at 35 and falling.
- It’s a lagging indicator (double-smoothed): it confirms, it doesn’t anticipate. In our method, it never decides alone — it over-confirms, in confluence with volume.
What the ADX really measures — and what it doesn’t say
The ADX was published by J. Welles Wilder in 1978 in New Concepts in Technical Trading Systems — pound for pound, the most profitable book in the history of technical analysis, since it also introduced the RSI, the ATR, and the Parabolic SAR. Four tools, forty-five years later, still on every chart.
Its promise is narrow, and that’s its strength: quantify the strength of directional movement, whatever that direction is. A market collapsing with conviction has a high ADX. A market climbing with conviction, too. A market that hesitates, that drifts without memory — the ADX caves in. That’s it, and it’s huge: most strategies don’t lose money because their signals are bad, but because they apply trend logic to a ranging market, or the reverse. The ADX is the thermometer that tells you which regime you’re in.
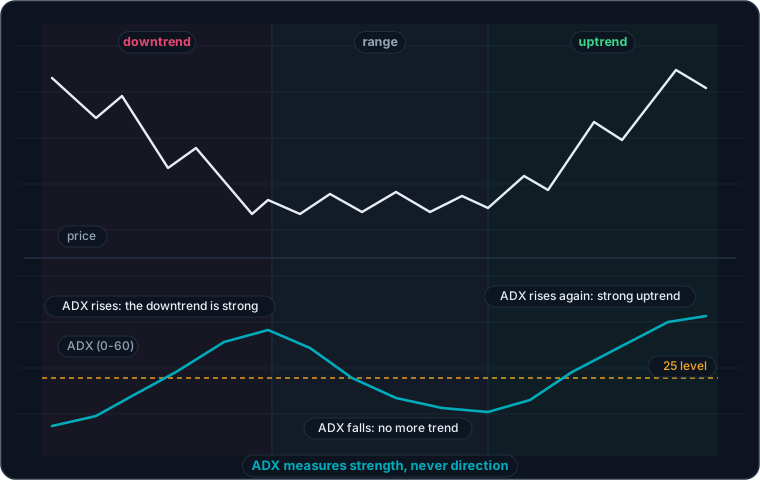
Trap #1, solved in a single image: the ADX climbs during the decline just as it does during the rally — it measures strength, never direction.
Study that diagram closely, because it’s THE confusion that costs money: a beginner sees the ADX climbing and thinks “bullish signal.” No. The ADX climbs because whichever trend is underway — bullish or bearish — is getting stronger. For direction, you have to look elsewhere: the price itself, or the system’s two other lines.
The DMI system: three lines, three roles
The ADX never travels alone: on your chart, the indicator is often labeled DMI (Directional Movement Index) and plots three lines:
| Line | Name | What it tells you |
|---|---|---|
| +DI | Positive Directional Indicator | The share of the move carried by buyers: the highs that keep climbing |
| −DI | Negative Directional Indicator | The share carried by sellers: the lows that keep sinking |
| ADX | Average Directional Index | The synthesis: the gap between the two, smoothed — the trend’s net strength |
The directional reading comes from the DI duel: +DI above −DI, buyers are in charge; the reverse, sellers are. And the ADX settles the question that remains: is that dominance decisive (the two lines pull apart, the ADX rises) or weak (they weave around each other, the ADX caves in)? When +DI and −DI keep crossing back and forth, every crossover feels like a signal — and that’s precisely where a low ADX saves you, telling you: nobody’s in charge, stay out or change your approach.
The calculation, step by step — to understand the lag
You’ll never have to calculate it by hand, but understanding the mechanics explains why the ADX behaves the way it does — including its lag. Six steps, over 14 periods by default:
- The True Range (TR). For each candle, the “true” range: the largest of the gaps between the high, the low, and the previous close. Its average is the ATR — yes, the ATR lives inside the ADX.
- Directional movement (+DM / −DM). If today’s high exceeds yesterday’s high, the difference is +DM. If today’s low breaks below yesterday’s low, that’s −DM. Key rule: only the larger of the two survives, the other is set to zero — a candle only pushes in one direction.
- Wilder’s smoothing. TR, +DM, and −DM are smoothed over 14 periods (Wilder’s moving average, slower than a classic EMA).
- The DIs. +DI = 100 × (smoothed +DM ÷ ATR): the buying push normalized by volatility. Same for −DI. That’s what makes the indicator comparable from one asset to another.
- The DX. 100 × |+DI − (−DI)| ÷ (+DI + (−DI)): the relative gap between buyers and sellers, from 0 (perfect balance) to 100 (only one side on the field).
- The ADX, at last. Wilder’s average of the DX over 14 periods — a second smoothing. It’s what gives the curve its clean shape… and it’s what creates the lag.
Remember step 6 above all: the ADX is a double-smoothed indicator. By the time it crosses 25, the trend has already been running for several candles. That’s not a hidden flaw, it’s the deal: the ADX confirms that a trend exists, it doesn’t predict one. As for the setting, 14 remains Wilder’s reference: dropping to 7 or 10 makes it twitchier but also more prone to lying; raising it to 20 makes it safer but slower.
Reading the ADX: the levels, then the slope
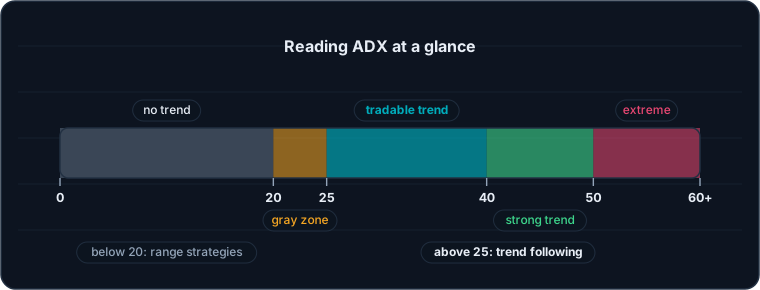
The reading scale: below 20, range strategies; above 25, trend following.
The classic thresholds — 20, 25, 40 — are landmarks, not laws. On a jumpy asset or a small timeframe, a “strong” ADX peaks lower than it would on a daily index. Take two minutes to look at your asset’s history on your timeframe: where does the ADX top out during real trends? That’s your own benchmark — not the textbook one.
And above all, read the slope before the level:
- ADX rising = the trend is strengthening. At 22 and climbing, it’s taking hold; at 35 and climbing, it’s accelerating.
- ADX falling from a peak = the trend is running out of steam… which most often signals a consolidation, not a reversal. Price can very well resume in the same direction after the pause.
- ADX pinned under 20 for a long stretch = the spring is compressing. Big trends are often born from an ADX that sat on the floor for weeks — watch for the breakout from range.
Three practical ways to use it
1. The regime filter — the most profitable use. Before looking for an entry, ask the ADX what world you’re in. Below 20: range logic — buy the bottom of the zone, sell the top, and run from breakouts that fizzle out. Above 25: trend-following logic — pullbacks in the direction of the move, as in swing trading. Most systems don’t die from bad signals: they die from applying the right signal in the wrong regime. (To settle “trend or range,” the ADX actually has a cousin built exactly for that, the Chop Index — the two overlap nicely.)
2. The DMI crossover, filtered by the ADX. The textbook signal: +DI crosses above −DI (buy) or the reverse (sell). Taken raw, this signal shreds your account in a range — the DIs keep re-crossing nonstop. The filter changes everything: you only take the crossover if the ADX is above 25 and rising. Stop below the last low (or above the last high), and an ADX that turns down serves as your exit alert.
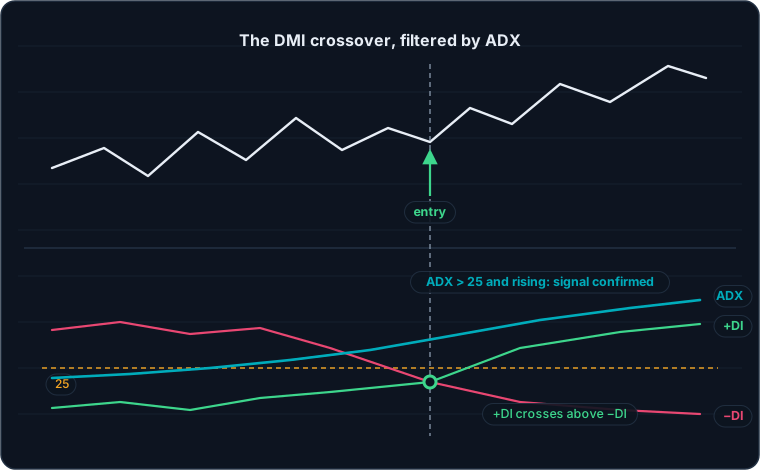
The +DI/−DI crossover is only worth taking filtered: ADX above 25 and rising, otherwise you let it pass.
3. Linda Raschke’s “Holy Grail.” Published in Street Smarts (1995) — the same cult book by Connors and Raschke whose turtle soup we’ve already broken down. The recipe: an ADX above 30 and rising certifies a powerful trend; you then wait for price to pull back to the EMA 20, and enter as the move resumes, stop below the pullback’s low. The idea is simple: in a real trend, the first pullback is a gift, and the ADX is exactly what separates real trends from fake ones.
What we actually do with it at Captain Trading
Our full trading strategy uses the ADX at two precise moments, and never on its own:
As over-confirmation for the screening. Once the setup is validated (position relative to the Bollinger middle line, EMA 9/12 crossover, MACD, RSI), we pop the hood one last time: rising volume and ADX above 25. In this guide’s case study, four cryptos passed the first cut — only PEPE (rising volume, ADX > 25) and SOL made it through; THETA and ORDI, with flat volume, were dropped. The important point: a non-confirmation doesn’t automatically invalidate the trade — it forces you to rethink the setup and adjust your size.
To calibrate the trailing stop. The distance of our trailing stop is ratio × ATR — and it’s the ADX that sets the ratio: 3 × ATR when the ADX is above 25 (strong trend: we give it room to breathe), 2.5 × ATR below that (fragile trend: we protect it on a shorter leash). A strength indicator that sizes the stop’s leash: that’s exactly the kind of quiet, unglamorous use that pays more than hunting for the perfect signal.
The classic traps
- Reading a direction into the ADX. Trap #1, always and forever: the ADX rises just as much when the market is crashing. Direction is read on the price or on the +DI/−DI duel, never on the ADX alone.
- Forgetting the lag. Double-smoothed, the ADX validates a trend that’s already underway. Using it as your sole entry trigger means systematically arriving after the move has already started.
- Selling because the ADX is falling. An ADX dropping back from 40 signals a pause, not necessarily a reversal. Closing everything because the gauge is weakening often means abandoning a trend that was just catching its breath.
- Trading every DMI crossover. Without an ADX filter, crossovers in a range are a commission grinder. No strength, no trade.
- Treating 25 as a universal constant. The right threshold depends on the asset and the timeframe — calibrate it against the history of whatever you’re trading.
- Entering because the ADX is “very strong.” Beyond 50, you’re not early, you’re late: ADX extremes often accompany the end of a move — the climax, not the start.
Frequently asked questions about the ADX
What’s the best setting for the ADX?
Wilder’s 14 periods remains the reference, and it’s the one we use. A shorter setting (7-10) reacts faster but multiplies false strength signals; a longer one (20+) only validates trends that are already obvious. Adjust your interpretation threshold to the asset rather than the period.
Does the ADX indicate market direction?
No, never. It measures the strength of the move, in either direction: a proper crash sends the ADX climbing exactly like a rally does. Direction is read on the price, or on the relative position of +DI and −DI. It’s the most common confusion — and the most costly one.
What’s the difference between the ADX and the DMI?
The DMI (Directional Movement Index) is Wilder’s complete system: +DI, −DI, and the ADX. The ADX is the third line of that system — the smoothed synthesis of the gap between the two DIs. On most platforms, adding “the ADX” actually plots the entire DMI.
ADX at 20 or 25: which threshold defines a trend?
Both hold up, and Wilder himself worked with this whole zone. In practice: below 20, no trend; between 20 and 25, a gray zone where you wait; above 25, a tradable trend — that’s the threshold we use in our screening. What matters is picking a threshold and testing it against your asset’s history, not debating the perfect number.
Why does the ADX rise when the price is falling?
Because it’s doing exactly its job: the decline is a trend, and a strong one. The ADX quantifies the conviction of the move, not its direction. If you want a directional gauge, watch −DI above +DI while the ADX rises: that’s the signature of a healthy downtrend in full force.
Does the ADX work in crypto?
Yes — it’s on crypto, in fact, that our strategy applies it, over-confirming alongside volume. Two precautions: a market open 24/7 doesn’t “breathe” the way a session-based market does, so calibrate your thresholds on each pair’s own history; and on small timeframes, noise makes the ADX’s slope unreliable — stay on the 15-minute chart and above for reading regime.
Going Further
The ADX will never tell you where the market is going — it tells you whether the market is going anywhere, and with how much conviction. That’s the first question to ask before any entry, and it’s why it’s lasted decades: as a regime filter, it makes almost every strategy you layer on top of it better.
The logical next step: see it at work in our complete strategy (screening and trailing stop), build it into your trading system with written rules, and check in your journal what the filter actually changes in your results. And if Wilder’s indicators interest you, his RSI and his ATR each have their own guide — the trio rounds out beautifully.
Every guide here is free. Browse the full course and join a community of traders who share ideas every day.